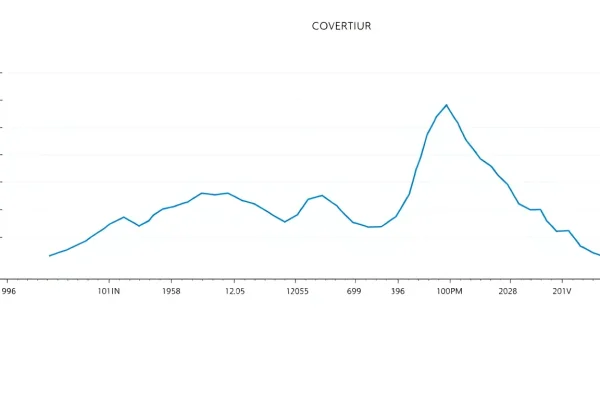
How to Read an Environmental Chart: The Keeling Curve and Atmospheric CO₂
The Keeling Curve shows the latest atmospheric CO₂ concentration at Mauna Loa Observatory: 426.55 parts per million (ppm) in February 2025, as reported by…
Topic archive
Composition, dynamics, and energy flows of the gaseous envelope.
The Keeling Curve shows the latest atmospheric CO₂ concentration at Mauna Loa Observatory: 426.55 parts per million (ppm) in February 2025, as reported by…