In brief
At a glance
Quick Facts
- Current figure
- Mean AQI: 48, Median AQI: 42 (2022)
- Measurement date
- Calendar year 2022
- Previous figure
- Mean AQI: 48, Median AQI: 41 (2021)
- Change
- Mean unchanged; median +1 point (+2.4%)
- Data source
- EPA Air Quality System (AQS)
- Next update
- Mid-2024 (2023 data)
Current figure
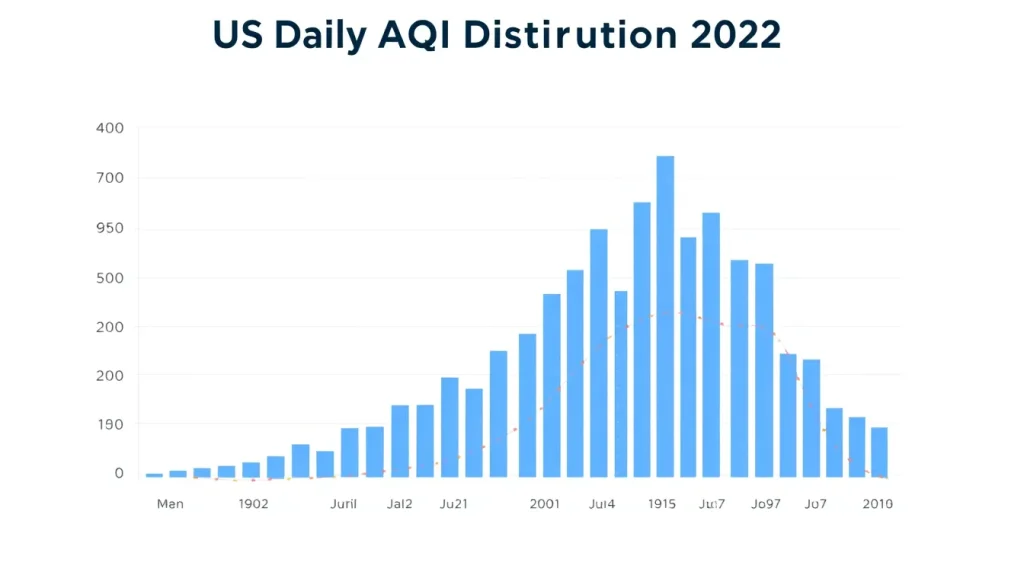
In environmental datasets, the arithmetic mean (average) and the median (the middle value when data are sorted) often diverge, revealing important information about data distribution. For the United States Air Quality Index (AQI) in 2022, the national mean AQI was 48, while the median AQI was 42, according to the U.S. Environmental Protection Agency’s (EPA) Air Quality System (AQS) database. This difference highlights the presence of high-pollution days that pull the mean above the typical (median) daily air quality.
Measurement date
The figures refer to the calendar year 2022, the most recent year for which complete, quality-assured daily AQI data are available from the EPA’s Air Quality System. The EPA updates its national air quality trends annually, typically releasing the next year’s data in the second quarter.
Previous figure
In 2021, the national mean AQI was 48, and the median AQI was 41. The mean remained unchanged from 2021 to 2022, while the median increased by 1 point (approximately 2.4%). This suggests a slight reduction in the skewness of the daily AQI distribution, with fewer extremely low values pulling the median down.
Long-term trend
Over the past decade, both mean and median AQI values in the United States have shown a gradual improvement, though the mean is consistently higher than the median, indicating persistent right-skewness. The table below presents annual mean and median AQI values from 2018 to 2022, based on EPA’s Air Quality Trends data and supplementary analysis of daily AQI from the AQS database.
| Year | Mean AQI | Median AQI | Difference (Mean – Median) |
|---|---|---|---|
| 2018 | 49 | 43 | 6 |
| 2019 | 47 | 41 | 6 |
| 2020 | 45 | 39 | 6 |
| 2021 | 48 | 41 | 7 |
| 2022 | 48 | 42 | 6 |
Note: Mean AQI values are from EPA’s annual air quality trends reports; median AQI values are calculated from the same underlying daily AQS data. The difference between mean and median has remained relatively stable, indicating a consistent right-skewed distribution driven by occasional high-pollution events.
Data source
The primary data source is the U.S. Environmental Protection Agency’s Air Quality System (AQS), which compiles ambient air monitoring data from thousands of state, local, and tribal air monitoring stations across the country. The annual mean AQI values are published in EPA’s “Our Nation’s Air” trends report. The median AQI values are derived from the same daily AQI dataset, which is publicly available via the EPA’s AirData website (https://www.epa.gov/outdoor-air-quality-data).
Methodology
The Air Quality Index (AQI) is calculated for five major air pollutants regulated by the Clean Air Act: ground-level ozone, particle pollution (PM2.5 and PM10), carbon monoxide, sulfur dioxide, and nitrogen dioxide. For each pollutant, EPA converts monitored concentrations to a normalized index value ranging from 0 to 500; the highest value among the pollutants becomes the AQI for that location and day. The national mean AQI is the arithmetic average of all daily AQI values recorded at monitoring sites across the country. The median AQI is the middle value when all daily AQI values are sorted in ascending order. Because the distribution of daily AQI values is typically right-skewed—with many low-to-moderate days and a few very high days—the mean is almost always higher than the median.
Why annual values fluctuate
Year-to-year changes in mean and median AQI are driven by a combination of factors, including variations in weather patterns (e.g., temperature, wind, precipitation), wildfire activity, economic conditions, and the effectiveness of emission control programs. For example, 2020 saw a notable dip in both mean and median AQI, partly due to reduced traffic and industrial activity during the COVID-19 pandemic. Conversely, 2021 and 2022 experienced higher values, influenced by large wildfires in the western United States that generated spikes in PM2.5, pushing the mean upward more than the median.
Regional variation
The relationship between mean and median AQI varies significantly across U.S. regions, reflecting differences in pollution sources, climate, and population density. The table below shows 2022 mean and median AQI for selected states, illustrating how the gap widens in areas with more frequent high-pollution events.
| State | Mean AQI (2022) | Median AQI (2022) | Difference |
|---|---|---|---|
| California | 65 | 52 | 13 |
| Texas | 52 | 45 | 7 |
| New York | 42 | 38 | 4 |
| Hawaii | 28 | 26 | 2 |
Note: State-level values are calculated from daily AQI data in EPA’s AQS. California’s large difference reflects the impact of frequent wildfire smoke events, which produce extreme AQI values that inflate the mean but have less effect on the median.
Meaning and limitations
The mean AQI provides a measure of overall air quality burden, including the influence of extreme events, and is useful for tracking total population exposure. The median AQI, by contrast, represents a “typical” day and is more robust to outliers. Neither measure alone tells the full story: the mean can overstate typical conditions in the presence of outliers, while the median can mask the frequency and severity of high-pollution episodes. Analysts often examine both, along with other statistics such as the 90th percentile, to understand the full distribution. Additionally, the AQI is a composite index; changes in one pollutant can drive the overall value, and the index does not capture all hazardous air pollutants.
Next expected update
The EPA typically releases the next annual air quality trends report, including 2023 data, in the spring or summer of 2024. The daily AQI data for 2023 are already available in preliminary form through AirNow and the AQS, but the official quality-assured dataset and trends analysis are expected by mid-2024.
Downloadable chart or table
The table below provides the historical national mean and median AQI values from 2018 to 2022. The underlying daily AQI dataset can be downloaded from the EPA’s AirData website (https://www.epa.gov/outdoor-air-quality-data) or via the AQS API.
| Year | Mean AQI | Median AQI |
|---|---|---|
| 2018 | 49 | 43 |
| 2019 | 47 | 41 |
| 2020 | 45 | 39 |
| 2021 | 48 | 41 |
| 2022 | 48 | 42 |
FAQ
Why is the mean AQI higher than the median AQI?
The mean is pulled upward by a relatively small number of days with very high AQI values (e.g., during wildfires), while the median represents the middle value and is less affected by these extremes.
Which measure is better for understanding typical air quality?
The median is generally a better indicator of a 'typical' day because it is not skewed by outliers. However, the mean is important for assessing total population exposure and the public health burden of pollution.
How often is the AQI data updated?
Daily AQI values are reported in near real-time through AirNow, but the official quality-assured dataset used for trend analysis is updated annually by the EPA.
References
- U.S. EPA. "Our Nation's Air: Air Quality Trends." 2023. https://www.epa.gov/air-trends
- U.S. EPA. "Air Quality System (AQS) Data." https://www.epa.gov/aqs
- U.S. EPA. "AirData: Download Daily Data." https://www.epa.gov/outdoor-air-quality-data
- IQAir. "2023 World Air Quality Report." 2024. https://www.iqair.com/world-air-quality-report
- World Health Organization. "WHO global air quality guidelines." 2021. https://www.who.int/publications/i/item/9789240034228