In brief
At a glance
Quick Facts
- Current figure
- Over 400 million data resources
- Measurement date
- 2024
- Previous figure
- ~200 million (2019)
- Change
- +200 million (+100%)
- Data source
- GEOSS Platform / Group on Earth Observations (GEO)
- Next update
- Continuously updated; next annual report early 2025
Current figure
The total number of environmental data resources accessible through the Global Earth Observation System of Systems (GEOSS) platform exceeds 400 million as of 2024. This aggregate figure encompasses primary, secondary, and tertiary sources, including in-situ measurements, satellite imagery, model outputs, and compiled datasets from national and international agencies. The GEOSS Platform, operated by the Group on Earth Observations (GEO), serves as a comprehensive gateway to Earth observation data from over 200 participating organizations worldwide.
Measurement date
The figure of over 400 million data resources is current as of 2024. The GEOSS Platform is continuously updated as new data providers join and existing providers expand their offerings. The platform does not follow a fixed annual release cycle; instead, the total number of accessible resources grows incrementally. The last major milestone was reported in GEO’s 2023 Annual Report, which noted that the platform had surpassed 400 million resources in early 2023, and the number has continued to increase since then.
Previous figure
In 2019, the GEOSS Platform provided access to approximately 200 million data resources. This represents an increase of 200 million resources, or a 100% growth, over the five-year period from 2019 to 2024. The doubling of available resources reflects the rapid expansion of Earth observation systems, the growing number of open data policies, and the integration of new data providers into the GEOSS ecosystem.
Long-term trend
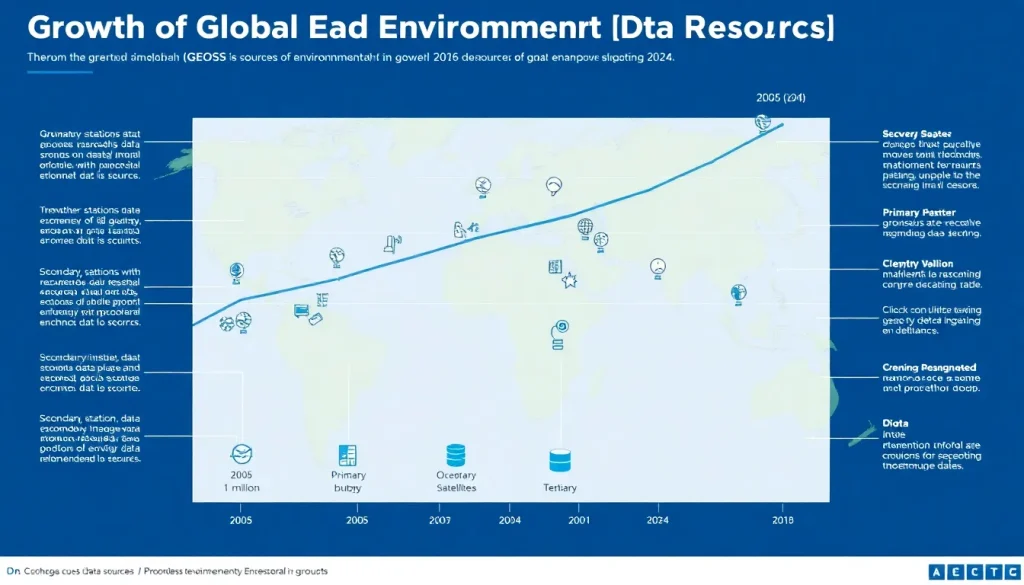
The number of environmental data sources has grown exponentially over the past two decades. In the early 2000s, environmental data were largely siloed within individual agencies, and global platforms like GEOSS were in their infancy. The launch of the GEOSS initiative in 2005 marked a turning point, with the number of shared data resources rising from a few million to over 400 million today. The table below illustrates the growth of GEOSS data resources over time.
| Year | Approximate Data Resources (millions) |
|---|---|
| 2005 | ~1 |
| 2010 | ~50 |
| 2015 | ~100 |
| 2019 | ~200 |
| 2024 | >400 |
This trend is driven by technological advances in sensor networks, satellite constellations, and data processing, as well as by policy frameworks such as the Open Data Charter and the FAIR data principles (Findable, Accessible, Interoperable, Reusable).
Data source
The primary data source for the aggregate figure is the GEOSS Platform (www.geoportal.org), maintained by the Group on Earth Observations (GEO). Additional authoritative sources for specific categories of environmental data include:
- World Meteorological Organization (WMO) – Global Observing System (GOS) for primary meteorological and climatological stations.
- NASA Earth Observing System Data and Information System (EOSDIS) – for secondary satellite data archives.
- World Bank Environment Data Portal – for tertiary compiled indicators.
- European Environment Agency (EEA) – for environmental data products and indicators.
Methodology
Environmental data sources are classified into three categories based on their proximity to the original measurement or observation:
- Primary sources provide raw or minimally processed data directly from sensors, instruments, or field observations. Examples include weather station readings, stream gauge measurements, and air quality monitor outputs. These data are often collected by national meteorological and hydrological services and shared through networks like the WMO Global Observing System, which comprises approximately 11,000 land stations, 1,300 upper-air stations, 4,000 ships, and 1,200 drifting buoys.
- Secondary sources involve processed, derived, or value-added products generated from primary data. Satellite imagery, climate reanalysis datasets, and model outputs fall into this category. For instance, NASA’s EOSDIS archives over 100 petabytes of Earth science data, including Level-2 and higher products that have been calibrated and georeferenced.
- Tertiary sources compile, aggregate, or synthesize information from primary and secondary sources into indicators, indices, or databases designed for policy and decision-making. The World Bank’s Environment Data portal, with over 1,400 indicators, and the EEA’s indicator reports are typical tertiary sources.
The GEOSS Platform counts a “data resource” as any uniquely identifiable dataset, service, or metadata record registered by a provider. The count includes both openly accessible and restricted resources, though the vast majority are open. The methodology does not distinguish between primary, secondary, and tertiary sources in the aggregate count; however, metadata tags allow users to filter by data type and processing level.
Why annual values fluctuate
The total number of environmental data resources does not fluctuate in a seasonal sense but can show stepwise increases due to:
- New satellite missions: The launch of new Earth observation satellites (e.g., Copernicus Sentinel series, NASA’s SWOT) adds large volumes of secondary data products.
- Network expansions: National weather services may install new automatic weather stations or upgrade existing ones, increasing primary data points.
- Data integration projects: When a new organization joins GEOSS, it may contribute millions of historical and real-time resources at once.
- Policy changes: Open data mandates can suddenly make previously restricted datasets publicly available.
Conversely, the count rarely decreases because data are seldom removed; even if a station is decommissioned, its historical data usually remain accessible. Thus, the trend is almost monotonically increasing.
Regional variation
The distribution of environmental data sources varies significantly by region, reflecting differences in economic development, institutional capacity, and historical investment in monitoring infrastructure. Primary sources (e.g., weather stations) are densest in North America, Europe, and parts of East Asia, while large areas of Africa, South America, and the polar regions remain sparsely observed. The table below shows the approximate number of WMO Global Observing System surface stations by region as of 2023.
| WMO Region | Approximate Number of Land Stations |
|---|---|
| Africa | ~1,200 |
| Asia | ~3,500 |
| South America | ~800 |
| North and Central America | ~2,500 |
| South-West Pacific | ~1,000 |
| Europe | ~2,000 |
Secondary sources, particularly satellite data, provide more uniform global coverage, helping to fill gaps in primary observations. Tertiary sources tend to be produced by international organizations and are often global in scope, though they may rely on uneven primary inputs, which can introduce biases.
Meaning and limitations
The total number of environmental data resources is a useful indicator of the growing availability of Earth observation information, but it has important limitations:
- Quantity does not equal quality: A high number of resources does not guarantee accuracy, timeliness, or fitness for purpose. Many datasets may be outdated or poorly documented.
- Accessibility varies: While GEOSS promotes open access, some resources remain behind registration walls or have usage restrictions.
- Duplication and fragmentation: The same dataset may be registered multiple times by different providers, inflating the count. Conversely, many valuable datasets are not yet shared through global platforms.
- Classification ambiguity: The line between primary, secondary, and tertiary sources can be blurry. For example, a quality-controlled weather station dataset might be considered secondary if it has undergone significant processing.
Users should therefore interpret the figure as a broad indicator of data abundance rather than a precise measure of usable information.
Next expected update
The GEOSS Platform is updated continuously, and no single “next release” date exists. However, GEO publishes an annual report each year (typically in the first quarter) that highlights key statistics, including the total number of data resources. The next annual report is expected in early 2025, which will provide an updated count. In the meantime, the real-time counter on the GEOSS Platform homepage reflects the current number.
Downloadable chart or table
The table below provides key historical data points for the growth of GEOSS data resources. Readers can download the underlying dataset from the GEO Knowledge Hub (https://knowledge.geo.org) or explore the live data via the GEOSS Platform API.
| Year | Approximate Data Resources (millions) | Notable Events |
|---|---|---|
| 2005 | ~1 | GEOSS established |
| 2010 | ~50 | First major data provider integrations |
| 2015 | ~100 | Copernicus programme begins data sharing |
| 2019 | ~200 | Open data policies expand |
| 2024 | >400 | Continuous growth, new satellite missions |
FAQ
What is the difference between primary, secondary, and tertiary environmental data sources?
Primary sources provide raw data directly from measurements (e.g., a weather station’s temperature reading). Secondary sources process or derive new products from primary data (e.g., a satellite-derived land cover map). Tertiary sources aggregate and synthesize information from multiple primary and secondary sources into indicators or databases (e.g., a country’s annual average temperature anomaly compiled from many stations).
How many primary environmental monitoring stations exist worldwide?
The World Meteorological Organization’s Global Observing System includes approximately 11,000 land stations, 1,300 upper-air stations, 4,000 ships, and 1,200 drifting buoys, among other platforms. However, this only covers meteorological and climatological observations; many other environmental domains (e.g., water quality, biodiversity) have their own networks, so the total number of primary monitoring sites is much larger and not centrally counted.
Why has the number of environmental data resources grown so rapidly?
The growth is driven by several factors: the launch of new Earth observation satellites (e.g., Copernicus Sentinels, NASA missions), the expansion of in-situ sensor networks, the adoption of open data policies by governments and organizations, and the development of platforms like GEOSS that make it easier to share and discover data. Additionally, advances in data storage and processing have enabled the archiving of vast historical datasets.
References
- GEOSS Platform – https://www.geoportal.org/ (accessed 2024)
- World Meteorological Organization, Global Observing System – https://public.wmo.int/en/programmes/global-observing-system
- NASA Earth Observing System Data and Information System (EOSDIS) – https://earthdata.nasa.gov/eosdis
- World Bank Environment Data – https://data.worldbank.org/topic/environment
- Group on Earth Observations (GEO) Annual Report 2023 – https://www.earthobservations.org