In brief
At a glance
Quick Facts
- Current figure
- 38 out of 100
- Measurement date
- 2022/23 (assessed July 2022 – June 2023)
- Previous figure
- 36 out of 100 (2020/21)
- Change
- +2 points (+5.6%)
- Data source
- Open Data Inventory (ODIN) by Open Data Watch
- Next update
- Expected in 2025 (ODIN 2024/25)
Current figure
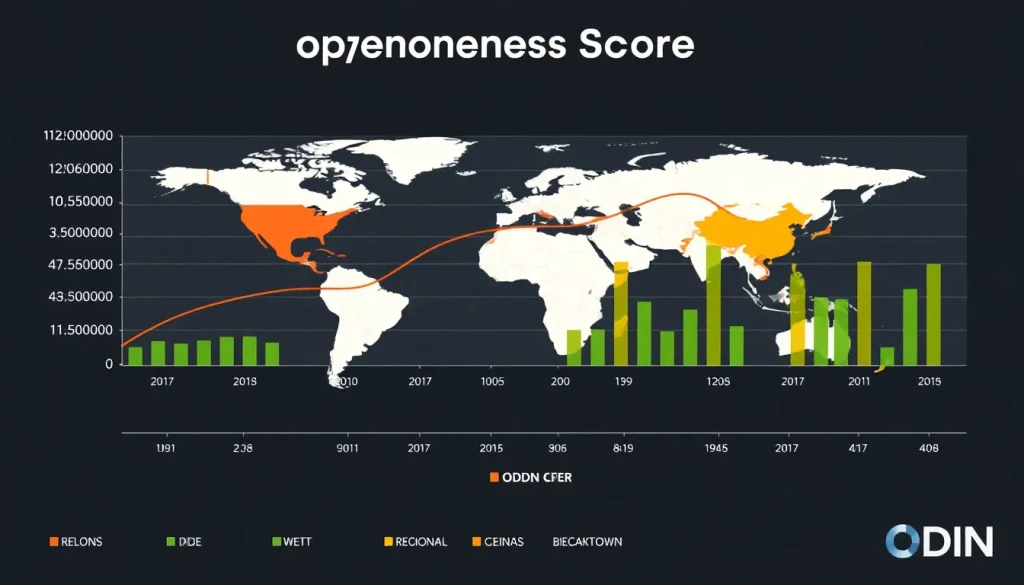
The global average openness score for environmental data stands at 38 out of 100, according to the Open Data Inventory (ODIN) 2022/23 report published by Open Data Watch. This score reflects the degree to which national statistical offices make key environmental datasets available to the public in machine-readable, non-proprietary formats, with appropriate metadata and open licenses.
Measurement date
The ODIN 2022/23 assessment was conducted between July 2022 and June 2023, covering data published by national statistical offices up to that period. The ODIN is updated biennially, with the next edition expected in 2024/25.
Previous figure
In the previous ODIN assessment (2020/21), the global average openness score for environmental data was 36 out of 100. This represents an increase of 2 points, or approximately 5.6%, over the two-year period. The improvement was driven by gains in data availability and machine readability in several countries.
Long-term trend
Since the first ODIN assessment in 2015, the global average openness score for environmental data has risen from 28 to 38, a 10-point increase. Progress has been steady but slow, with an average increase of about 2.5 points per assessment cycle. The table below shows the trend:
| ODIN Edition | Year | Global Average Environmental Openness Score |
|---|---|---|
| ODIN 1 | 2015 | 28 |
| ODIN 2 | 2016/17 | 30 |
| ODIN 3 | 2018/19 | 33 |
| ODIN 4 | 2020/21 | 36 |
| ODIN 5 | 2022/23 | 38 |
Data source
The primary data source is the Open Data Inventory (ODIN) 2022/23, published by Open Data Watch, a non-profit organization that monitors the openness and coverage of official statistics worldwide. The full dataset and methodology are available at https://odin.opendatawatch.com/.
Methodology
ODIN assesses the openness and coverage of data published on national statistical office (NSO) websites. For environmental data, it evaluates 5 subcategories: air quality, water quality, land use, biodiversity, and climate. Each subcategory is scored on a scale of 0 to 100 based on two dimensions: openness (whether data are machine-readable, non-proprietary, have metadata, and are available in bulk) and coverage (whether key indicators are available, disaggregated, and cover the last 10 years). The overall environmental score is the average of the subcategory scores. Data are collected by researchers who visit NSO websites and fill out a standardized questionnaire. The assessment is then reviewed by a second researcher and validated by the NSO when possible.
Why annual values fluctuate
The ODIN score for environmental data can change from one assessment to the next due to several factors: actual improvements in data publication by NSOs, changes in the ODIN methodology (e.g., new indicators added), and the dynamic nature of websites (data may be temporarily unavailable during the assessment period). Additionally, some countries may launch new open data portals or update existing ones, leading to score increases, while others may remove datasets or change formats, causing decreases. The score is not a direct measure of environmental data quality but of its accessibility and openness.
Regional variation
Openness of environmental data varies significantly by region. Europe and Central Asia lead with an average score of 55, while Sub-Saharan Africa lags at 22. The table below shows regional averages from ODIN 2022/23:
| Region | Average Environmental Openness Score (0-100) |
|---|---|
| Europe & Central Asia | 55 |
| North America | 52 |
| Latin America & Caribbean | 38 |
| East Asia & Pacific | 35 |
| Middle East & North Africa | 28 |
| South Asia | 25 |
| Sub-Saharan Africa | 22 |
High-income countries generally score above 60, while low-income countries average below 20. However, some lower-middle-income countries like Rwanda and Moldova have achieved relatively high scores through dedicated open data initiatives.
Meaning and limitations
The ODIN environmental openness score measures the accessibility and machine-readability of key environmental datasets published by national statistical offices. A higher score indicates that data are more findable, usable, and interoperable. However, the score has important limitations: it does not assess data accuracy, timeliness, or completeness beyond the presence of key indicators. It only evaluates data published on NSO websites, missing data held by other government agencies or in non-digital formats. Moreover, the score reflects a snapshot in time and may not capture recent improvements.
Open environmental data offers significant benefits. It enables evidence-based policymaking, supports scientific research, empowers citizens and journalists to hold governments accountable, and fosters innovation in environmental monitoring and management. For example, open air quality data has been used to develop mobile apps that inform the public about pollution levels, while open water quality data supports transboundary water management. Despite these benefits, substantial gaps remain. Critical areas such as real-time air and water quality data, biodiversity inventories, and climate adaptation indicators are often missing or published in non-machine-readable formats like PDF. Low-income countries frequently lack the resources to collect and publish comprehensive environmental data, perpetuating data poverty. Additionally, even when data are open, they may not adhere to FAIR principles (Findable, Accessible, Interoperable, Reusable), limiting their practical utility. The ODIN score highlights these gaps and serves as a call to action for governments and international organizations to invest in open data infrastructure.
Next expected update
The next edition of the Open Data Inventory (ODIN) is expected to be published in 2025, covering data available in 2024. Open Data Watch typically releases the report biennially, with the next assessment cycle likely to begin in mid-2024.
Downloadable chart or table
The following table provides the global average environmental openness scores from all ODIN editions. The full dataset, including country-level scores and detailed indicator assessments, can be downloaded from the ODIN website at https://odin.opendatawatch.com/.
| ODIN Edition | Year | Global Average Environmental Openness Score (0-100) |
|---|---|---|
| ODIN 1 | 2015 | 28 |
| ODIN 2 | 2016/17 | 30 |
| ODIN 3 | 2018/19 | 33 |
| ODIN 4 | 2020/21 | 36 |
| ODIN 5 | 2022/23 | 38 |
FAQ
What is open environmental data?
Open environmental data refers to environmental information—such as air and water quality measurements, biodiversity records, and climate statistics—that is made publicly available in machine-readable formats under an open license, allowing anyone to access, use, and share it without restrictions.
What are the main benefits of open environmental data?
Open environmental data enables evidence-based policymaking, supports scientific research, increases transparency and accountability, empowers citizens and journalists, and fosters innovation in environmental monitoring and management. For example, it has been used to develop air quality apps, track deforestation, and model climate change impacts.
What are the key gaps and limitations in open environmental data?
Key gaps include the lack of real-time data, incomplete coverage of critical indicators (e.g., biodiversity, water quality), and publication in non-machine-readable formats like PDF. Limitations of openness assessments like ODIN include that they do not measure data accuracy or timeliness, and they only capture data on national statistical office websites, missing other government sources.
References
- Open Data Watch. (2023). Open Data Inventory 2022/23 Report. https://odin.opendatawatch.com/
- Open Data Watch. (2021). Open Data Inventory 2020/21 Report. https://odin.opendatawatch.com/
- World Wide Web Foundation. (2016). Open Data Barometer 4th Edition. https://opendatabarometer.org/
- GO FAIR. (n.d.). FAIR Principles. https://www.go-fair.org/fair-principles/
- World Bank. (2023). Open Data Initiative. https://data.worldbank.org/