In brief
At a glance
Quick Facts
- Current figure
- 426.55 ppm
- Measurement date
- February 2025
- Previous figure
- 425.41 ppm (January 2025)
- Change
- +1.14 ppm (+0.27%)
- Data source
- NOAA Global Monitoring Laboratory
- Next update
- Early April 2025 (for March 2025)
Current figure
The latest monthly average atmospheric carbon dioxide (CO₂) concentration measured at the Mauna Loa Observatory is 426.55 parts per million (ppm) for February 2025. This figure represents the mole fraction of CO₂ in dry air, reported by the National Oceanic and Atmospheric Administration (NOAA) Global Monitoring Laboratory.
Measurement date
The value of 426.55 ppm is the monthly mean for February 2025, based on daily averages recorded at the Mauna Loa Observatory in Hawaii. NOAA updates this dataset monthly, typically releasing preliminary data within the first week of the following month. The February 2025 figure was published in early March 2025.
Previous figure
The monthly mean CO₂ concentration for January 2025 was 425.41 ppm. The change from January to February 2025 is an increase of 1.14 ppm, or approximately 0.27%. This month-over-month rise is typical for the late winter period, as CO₂ accumulates in the atmosphere before the Northern Hemisphere growing season begins.
Long-term trend
Atmospheric CO₂ has risen steadily since continuous measurements began at Mauna Loa in 1958. The annual average has increased from about 315 ppm in 1958 to 421.08 ppm in 2024 (NOAA). The rate of increase has accelerated: in the 1960s, the annual growth rate was about 0.8 ppm per year; in the 2010s and 2020s, it has averaged around 2.4 ppm per year. The following table shows annual mean CO₂ concentrations for selected years:
| Year | Annual Mean CO₂ (ppm) |
|---|---|
| 1960 | 316.91 |
| 1970 | 325.68 |
| 1980 | 338.75 |
| 1990 | 354.39 |
| 2000 | 369.55 |
| 2010 | 389.90 |
| 2020 | 414.24 |
| 2024 | 421.08 |
Source: NOAA Global Monitoring Laboratory, Mauna Loa annual mean data.
Data source
The primary data source is the NOAA Global Monitoring Laboratory (GML), which maintains the Mauna Loa Observatory in Hawaii. The dataset is publicly available at gml.noaa.gov/ccgg/trends/. The Scripps Institution of Oceanography also independently measures CO₂ at Mauna Loa and publishes its own record, which closely matches NOAA’s. Both programs are part of the Global Greenhouse Gas Reference Network.
Methodology
CO₂ concentrations are measured using high-precision, non-dispersive infrared (NDIR) analyzers. Air samples are drawn continuously from an intake tower at the Mauna Loa Observatory, located at an elevation of 3,397 meters on the island of Hawaii. The site was chosen for its remote location and minimal local contamination. Measurements are reported as dry-air mole fractions, meaning water vapor is removed before analysis. The monthly mean is calculated from daily averages, which themselves are derived from hourly averages. NOAA also performs flask sampling for calibration and quality control. The data are reported on the WMO CO₂ X2019 scale, ensuring consistency with global standards.
Why annual values fluctuate
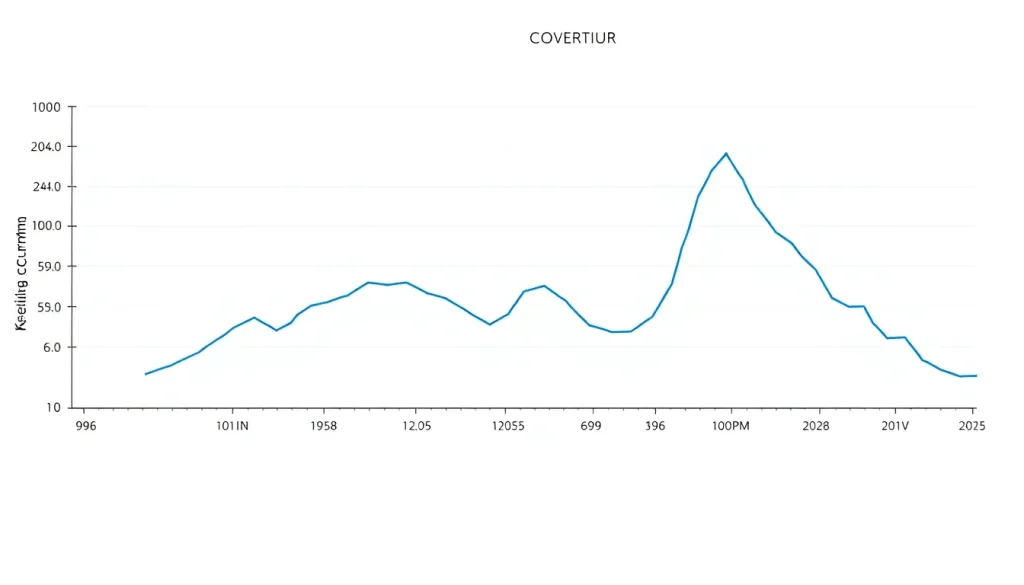
The Keeling Curve exhibits a distinct sawtooth pattern: CO₂ levels rise from October through May and decline from May through October. This seasonal cycle is driven primarily by the Northern Hemisphere’s terrestrial biosphere. During the spring and summer, plants photosynthesize, drawing down CO₂ from the atmosphere. In fall and winter, respiration and decomposition release CO₂ back. Because the Northern Hemisphere has a much larger land mass and vegetation area than the Southern Hemisphere, this cycle dominates the global signal. The annual peak typically occurs in May, and the trough in September or October. The long-term upward trend is superimposed on this cycle, driven by human emissions from fossil fuel combustion and land-use change.
Regional variation
CO₂ concentrations vary by location, altitude, and proximity to sources. The Mauna Loa record is considered representative of the well-mixed background atmosphere in the Northern Hemisphere mid-latitudes. However, other stations show different absolute values and seasonal amplitudes. For example, the South Pole Observatory records lower concentrations (around 418 ppm in 2024) and a smaller seasonal cycle because of the larger ocean surface and less land vegetation. Urban stations can record much higher values due to local emissions. The table below compares annual mean CO₂ at several NOAA baseline observatories for 2023:
| Station | Latitude | 2023 Annual Mean CO₂ (ppm) |
|---|---|---|
| Mauna Loa, Hawaii | 19.5° N | 421.0 |
| Barrow, Alaska | 71.3° N | 424.6 |
| American Samoa | 14.2° S | 420.2 |
| South Pole | 90.0° S | 418.5 |
Source: NOAA Global Monitoring Laboratory, 2023 annual means.
Meaning and limitations
The Keeling Curve is one of the most iconic environmental charts, providing clear evidence of the rapid rise in atmospheric CO₂ due to human activities. It is a direct measure of the changing composition of the atmosphere. However, it does not directly show emissions; it shows the net accumulation after natural sinks (oceans and land) absorb about half of human emissions. The Mauna Loa record is a single-point measurement, though it is broadly representative of the Northern Hemisphere free troposphere. Local sources (e.g., volcanic activity on Mauna Loa) can occasionally contaminate the data, but these periods are flagged and removed. The chart also does not capture other greenhouse gases like methane or nitrous oxide, which require separate monitoring.
Next expected update
NOAA releases preliminary monthly mean CO₂ data for Mauna Loa around the 5th of each month, covering the previous month. The next update, for March 2025, is expected in early April 2025. Finalized data may be adjusted slightly in subsequent months as quality control is completed.
Downloadable chart or table
The table below provides recent monthly mean CO₂ values from Mauna Loa (NOAA data). The full dataset, including daily and hourly data, can be downloaded from NOAA GML’s data page.
| Year | Month | Monthly Mean CO₂ (ppm) |
|---|---|---|
| 2024 | Nov | 423.71 |
| 2024 | Dec | 424.63 |
| 2025 | Jan | 425.41 |
| 2025 | Feb | 426.55 |
Note: Data are preliminary and subject to revision. Always refer to the original source for the most up-to-date values.
FAQ
What is the Keeling Curve?
The Keeling Curve is a graph that plots the ongoing change in concentration of carbon dioxide in Earth's atmosphere since 1958. It is based on continuous measurements taken at the Mauna Loa Observatory in Hawaii under the supervision of the Scripps Institution of Oceanography and NOAA. The curve shows both a long-term upward trend driven by human emissions and a seasonal sawtooth pattern caused by plant growth and decay.
Why does the CO₂ concentration fluctuate up and down each year?
The seasonal fluctuation is primarily due to the Northern Hemisphere's vegetation. During spring and summer, plants absorb CO₂ through photosynthesis, reducing atmospheric levels. In fall and winter, leaves decay and respiration releases CO₂ back into the air. Because the Northern Hemisphere has much more land and vegetation, this cycle dominates the global signal, creating a regular annual pattern.
How is atmospheric CO₂ measured?
CO₂ is measured using non-dispersive infrared (NDIR) analyzers that detect the absorption of infrared light by CO₂ molecules. Air samples are drawn continuously from an intake tower, dried to remove water vapor, and analyzed. The measurements are calibrated against standard gas mixtures traceable to the World Meteorological Organization (WMO) scale. Flask samples are also collected periodically for independent verification.
References
- NOAA Global Monitoring Laboratory, Trends in Atmospheric Carbon Dioxide, Mauna Loa CO₂ monthly mean data, accessed April 2025.
- Scripps Institution of Oceanography, The Keeling Curve, https://keelingcurve.ucsd.edu/
- NOAA Global Monitoring Laboratory, 2023 Annual Mean CO₂ at Baseline Observatories.
- WMO Greenhouse Gas Bulletin, No. 20, 2024.
- IPCC Sixth Assessment Report, Working Group I, Chapter 2, 2021.