In brief
At a glance
Quick Facts
- Current figure
- 36.1 GtCO2 (global production-based, 2022)
- Measurement date
- Calendar year 2022
- Previous figure
- 36.3 GtCO2 (2021)
- Change
- -0.2 GtCO2 (-0.6%)
- Data source
- Global Carbon Project, Global Carbon Budget 2023
- Next update
- November/December 2024
Current figure
Global production-based carbon dioxide (CO2) emissions from fossil fuel combustion and industrial processes (cement production, flaring) reached 36.1 gigatonnes (GtCO2) in 2022, according to the Global Carbon Budget 2023 published by the Global Carbon Project. Consumption-based emissions, which adjust for the carbon embedded in international trade, are identical at the global level because imports and exports cancel out. However, for individual countries, the two metrics diverge significantly. For example, China’s production-based emissions were 11.4 GtCO2 in 2022, while its consumption-based emissions were 10.7 GtCO2, indicating that China is a net exporter of emissions. The United States had production-based emissions of 5.0 GtCO2 and consumption-based emissions of 5.8 GtCO2, reflecting its role as a net importer of carbon-intensive goods. The European Union (EU27) recorded 2.8 GtCO2 production-based and 3.5 GtCO2 consumption-based, and India’s figures were 2.8 GtCO2 and 2.5 GtCO2, respectively. These numbers highlight the substantial redistribution of emissions through global supply chains.
Measurement date
The current figures refer to the calendar year 2022. The Global Carbon Budget 2023, which contains these data, was released in December 2023. The dataset is updated annually, typically in November or December, with a one-year lag due to the time required to collect and process national and international energy statistics. Preliminary estimates for the most recent year are sometimes published earlier, but the definitive consumption-based emissions are only available with the full budget release.
Previous figure
In 2021, global production-based CO2 emissions were 36.3 GtCO2. The 2022 value of 36.1 GtCO2 represents a decrease of 0.2 GtCO2, or approximately 0.6%. This slight decline followed a sharp rebound from the pandemic-induced drop in 2020, when emissions fell to 34.8 GtCO2. For consumption-based emissions, the global total is the same as production-based by definition, so the change is identical. At the country level, the gap between the two metrics also shifted: for instance, the US consumption-based emissions decreased from 5.9 GtCO2 in 2021 to 5.8 GtCO2 in 2022, while China’s consumption-based emissions rose from 10.5 GtCO2 to 10.7 GtCO2 over the same period.
Long-term trend
Global production-based CO2 emissions have risen substantially over the past three decades, from 22.7 GtCO2 in 1990 to 36.1 GtCO2 in 2022, an increase of about 59%. The growth has been driven primarily by emerging economies, while many developed countries have seen stable or declining territorial emissions. However, consumption-based emissions reveal that some developed countries have effectively outsourced part of their carbon footprint through imports of manufactured goods. For example, between 1990 and 2022, US production-based emissions increased by only about 2%, but consumption-based emissions grew by roughly 15%. In contrast, China’s production-based emissions more than quadrupled, while its consumption-based emissions grew slightly less, reflecting its role as the world’s factory. The table below shows the historical trend in global production-based emissions.
| Year | Global production-based CO2 emissions (GtCO2) |
|---|---|
| 1990 | 22.7 |
| 2000 | 25.6 |
| 2010 | 33.0 |
| 2015 | 35.4 |
| 2019 | 36.7 |
| 2020 | 34.8 |
| 2021 | 36.3 |
| 2022 | 36.1 |
Consumption-based emissions follow a similar global trajectory but with notable differences at the regional level. The gap between production and consumption emissions has widened for many developed nations, underscoring the importance of trade-adjusted accounting.
Data source
The primary data source is the Global Carbon Budget 2023, published by the Global Carbon Project (GCP) in the journal Earth System Science Data (Friedlingstein et al., 2023). The GCP is an international consortium of scientists that annually compiles and analyses global carbon cycle data. The consumption-based emissions estimates are derived from the GCP’s territorial emissions data combined with trade flow data from multi-regional input-output (MRIO) tables, primarily using the Global Trade Analysis Project (GTAP) database. The data are also accessible via Our World in Data (https://ourworldindata.org/co2-emissions), which republishes the GCP dataset in a user-friendly format.
Methodology
Production-based (territorial) emissions are calculated using activity data—such as fossil fuel combustion statistics and cement production—multiplied by emission factors, following guidelines from the Intergovernmental Panel on Climate Change (IPCC). These territorial emissions are reported by countries to the United Nations Framework Convention on Climate Change (UNFCCC) and form the basis of national inventories.
Consumption-based emissions are estimated by adjusting production-based emissions for international trade. The adjustment adds emissions embodied in imported goods and services and subtracts emissions embodied in exports. This requires detailed MRIO models that trace the flow of goods and their associated carbon footprints across borders. The GCP uses the GTAP database, which covers 121 countries and 65 sectors, to construct these estimates. The methodology accounts for the entire supply chain, including intermediate inputs, to allocate emissions to the final consumer. Because of the complexity of trade data and the need for harmonization, consumption-based estimates are typically available with a longer time lag and have higher uncertainty than territorial emissions.
Why annual values fluctuate
Year-to-year changes in emissions are influenced by a variety of factors. Economic growth or recession directly affects energy demand and industrial output. Energy prices, particularly for coal and natural gas, can shift the fuel mix. Weather conditions—such as cold winters or hot summers—alter heating and cooling needs. Technological changes, such as the rapid deployment of renewables, can also cause fluctuations. The COVID-19 pandemic caused a sharp but temporary drop in 2020, followed by a rebound in 2021. Fluctuations in trade patterns, such as shifts in manufacturing locations or disruptions to supply chains, can affect the gap between production-based and consumption-based emissions for individual countries. For example, a country that increases its imports of steel will see its consumption-based emissions rise even if its territorial emissions remain unchanged.
Regional variation
There is significant regional variation in the relationship between production-based and consumption-based emissions. Net exporters of emissions (where production-based > consumption-based) include China, India, Russia, and many other emerging economies. Net importers include the United States, the European Union, Japan, and other high-income nations. The table below shows the top 10 emitters for both accounting methods in 2022, based on Global Carbon Project data.
| Country/Region | Production-based (GtCO2) | Consumption-based (GtCO2) | Net transfer (GtCO2) |
|---|---|---|---|
| China | 11.4 | 10.7 | -0.7 (exporter) |
| United States | 5.0 | 5.8 | +0.8 (importer) |
| EU27 | 2.8 | 3.5 | +0.7 (importer) |
| India | 2.8 | 2.5 | -0.3 (exporter) |
| Russia | 1.7 | 1.1 | -0.6 (exporter) |
| Japan | 1.1 | 1.5 | +0.4 (importer) |
| Iran | 0.7 | 0.6 | -0.1 (exporter) |
| Germany | 0.7 | 0.9 | +0.2 (importer) |
| Saudi Arabia | 0.6 | 0.5 | -0.1 (exporter) |
| South Korea | 0.6 | 0.8 | +0.2 (importer) |
Note: Net transfer is the difference between consumption-based and production-based emissions. Positive values indicate net import of emissions; negative values indicate net export. Data are rounded to one decimal place.
Meaning and limitations
Production-based emissions are the standard metric for international climate agreements, such as the Paris Agreement, and for national greenhouse gas inventories reported to the UNFCCC. They measure emissions that physically occur within a country’s borders, making them directly attributable to domestic policies and activities. Consumption-based emissions provide a complementary perspective by attributing emissions to the final consumer, regardless of where the goods were produced. This metric highlights carbon leakage—the phenomenon where stringent climate policies in one country may lead to the relocation of emission-intensive industries to countries with weaker regulations, without reducing global emissions. It also reveals the true carbon footprint of consumption patterns in wealthy nations.
However, consumption-based estimates have important limitations. They are model-dependent and subject to higher uncertainty than territorial emissions due to the complexity of trade data and the assumptions in input-output models. The estimates typically cover only CO2 from fossil fuels and industry, excluding other greenhouse gases (e.g., methane, nitrous oxide) and emissions from land-use change, which can be significant. Additionally, the allocation of emissions along global supply chains can be contentious, as it involves decisions about how to attribute emissions from intermediate goods. Both metrics are essential for a comprehensive understanding of responsibility for climate change, and they should be used together to inform policy.
Next expected update
The Global Carbon Budget 2024, containing data for the year 2023, is expected to be published in November or December 2024. The release follows an annual cycle, with preliminary estimates sometimes available earlier in the year. The consumption-based emissions dataset is typically updated at the same time as the territorial emissions, though it may be subject to revision as trade data are refined.
Downloadable chart or table
The table below provides key historical data points for global production-based CO2 emissions. The full dataset, including consumption-based emissions for all countries, can be downloaded from the Global Carbon Project website (https://www.globalcarbonproject.org/) or from Our World in Data (https://ourworldindata.org/co2-emissions).
| Year | Global production-based CO2 emissions (GtCO2) |
|---|---|
| 1990 | 22.7 |
| 1995 | 23.5 |
| 2000 | 25.6 |
| 2005 | 29.4 |
| 2010 | 33.0 |
| 2015 | 35.4 |
| 2019 | 36.7 |
| 2020 | 34.8 |
| 2021 | 36.3 |
| 2022 | 36.1 |
For consumption-based emissions by country, users can explore interactive charts and download CSV files from the Our World in Data CO2 emissions page, which sources data directly from the Global Carbon Project.
FAQ
What is the difference between production-based and consumption-based emissions?
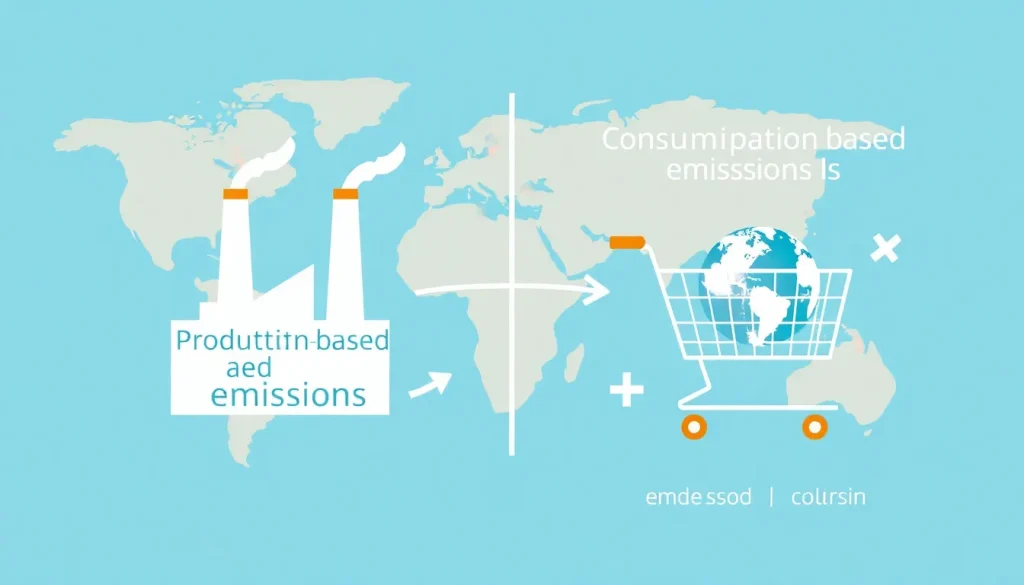
Production-based emissions measure the CO2 released within a country's borders from fossil fuel burning and industrial processes. Consumption-based emissions adjust this figure by adding emissions embedded in imported goods and subtracting emissions embedded in exports, thus attributing emissions to the final consumer. At the global level, the two totals are equal, but they differ for individual countries depending on their trade balance in carbon-intensive products.
Why do some countries have higher consumption-based emissions than production-based?
Countries that import more carbon-intensive goods than they export will have higher consumption-based emissions. This is common in wealthy, service-oriented economies that have outsourced manufacturing to other nations. For example, the United States and many European countries are net importers of emissions, meaning their consumption-based footprint exceeds their territorial emissions.
How are consumption-based emissions calculated?
Consumption-based emissions are estimated using multi-regional input-output (MRIO) models that track the flow of goods and services between countries and sectors. These models combine trade data with emission intensities per sector to calculate the total carbon footprint of final consumption. The Global Carbon Project uses the GTAP database to produce annual estimates, which are subject to higher uncertainty than territorial emissions due to data and modeling limitations.
References
- Friedlingstein, P., et al. (2023). Global Carbon Budget 2023. Earth System Science Data, 15, 5301–5369. https://doi.org/10.5194/essd-15-5301-2023
- Global Carbon Project. (2023). Global Carbon Budget 2023. https://www.globalcarbonproject.org/
- Our World in Data. CO2 emissions. https://ourworldindata.org/co2-emissions
- IPCC. (2006). 2006 IPCC Guidelines for National Greenhouse Gas Inventories. https://www.ipcc-nggip.iges.or.jp/public/2006gl/
- Davis, S. J., & Caldeira, K. (2010). Consumption-based accounting of CO2 emissions. Proceedings of the National Academy of Sciences, 107(12), 5687-5692.