In brief
At a glance
Quick Facts
- Current figure
- 159.7 million (seasonally adjusted, March 2025)
- Measurement date
- March 2025 (reference week including the 12th)
- Previous figure
- 159.5 million (February 2025, seasonally adjusted)
- Change
- +228,000 (+0.14%)
- Data source
- U.S. Bureau of Labor Statistics, Current Employment Statistics
- Next update
- May 2, 2025 (for April 2025 data)
Current figure
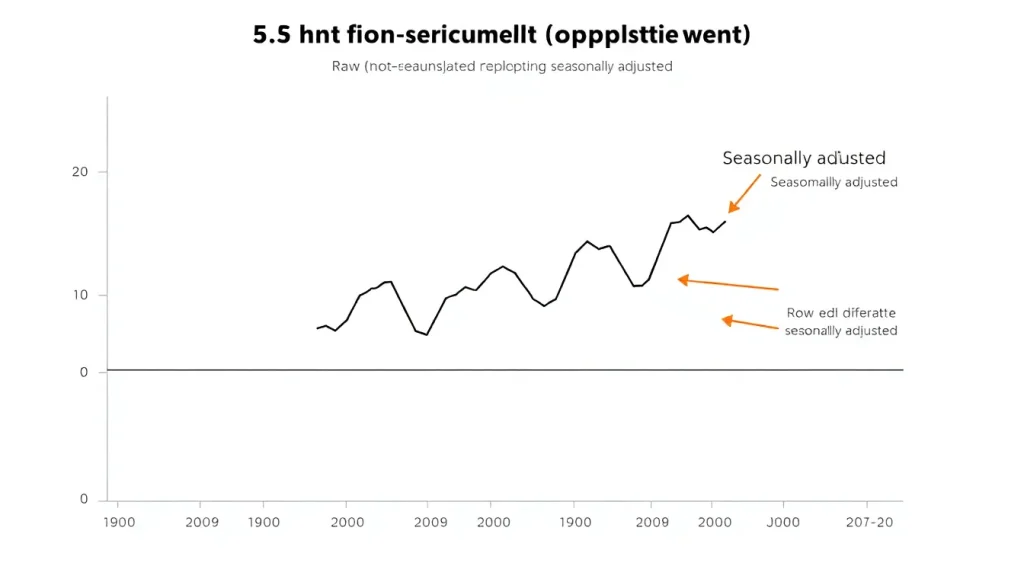
In March 2025, total nonfarm payroll employment in the United States was 159.7 million on a seasonally adjusted basis, according to the U.S. Bureau of Labor Statistics (BLS) Employment Situation report released on April 4, 2025. The not seasonally adjusted figure for the same month was approximately 159.2 million, meaning the seasonal adjustment process removed an estimated 500,000 jobs from the raw count to account for typical March patterns, such as the end of holiday-related temporary hiring and winter slowdowns.
Measurement date
The current figure refers to the reference week that includes the 12th of March 2025. The BLS publishes the Employment Situation report monthly, typically on the first Friday following the reference month. The data are updated each month, with preliminary estimates for the most recent month and revisions to the prior two months.
Previous figure
The seasonally adjusted total nonfarm payroll employment for February 2025 was 159.5 million (revised from an initial estimate of 159.5 million). The change from February to March 2025 was an increase of 228,000 jobs, or approximately 0.14%. The not seasonally adjusted change over the same period was larger, reflecting the typical seasonal rebound from January lows.
Long-term trend
Seasonally adjusted U.S. nonfarm employment has grown steadily since the trough of the COVID-19 recession in April 2020, recovering all lost jobs by mid-2022 and continuing to expand. The use of seasonal adjustment has become standard practice for many economic indicators since the mid-20th century, with methods evolving from simple moving averages to sophisticated model-based approaches. The table below shows annual average seasonally adjusted employment levels over the past decade.
| Year | Annual Average Employment (millions, SA) |
|---|---|
| 2015 | 141.8 |
| 2016 | 144.3 |
| 2017 | 146.6 |
| 2018 | 148.9 |
| 2019 | 150.9 |
| 2020 | 142.2 |
| 2021 | 145.9 |
| 2022 | 152.5 |
| 2023 | 156.1 |
| 2024 | 158.7 |
Source: U.S. Bureau of Labor Statistics, Current Employment Statistics survey, annual averages.
Data source
The primary source for U.S. employment data is the Current Employment Statistics (CES) survey, also known as the establishment survey, conducted by the U.S. Bureau of Labor Statistics. The survey samples approximately 119,000 businesses and government agencies, covering about 629,000 worksites. The data are published in the monthly Employment Situation news release. Seasonal adjustment is performed by the BLS using the X-13ARIMA-SEATS software developed by the U.S. Census Bureau.
Methodology
Seasonal adjustment is the process of estimating and removing systematic calendar-related influences from a time series. The most widely used method is the X-13ARIMA-SEATS procedure, which combines the X-13ARIMA seasonal adjustment algorithm with the SEATS (Signal Extraction in ARIMA Time Series) method. The steps include:
- Model identification: An ARIMA (AutoRegressive Integrated Moving Average) model is fitted to the series to capture its trend, seasonal, and irregular components.
- Seasonal factor estimation: The model estimates multiplicative or additive seasonal factors for each calendar month or quarter. For employment, a multiplicative model is typically used, meaning the seasonal effect is proportional to the level of the series.
- Calendar effects: Adjustments are made for trading-day differences (e.g., number of weekdays in a month) and moving holidays (e.g., Easter).
- Outlier detection: Extreme values (e.g., pandemic-related job losses) are identified and treated to avoid distorting seasonal factors.
- Decomposition: The series is decomposed into trend-cycle, seasonal, and irregular components. The seasonally adjusted series is the original series divided by (or minus) the seasonal factor.
The BLS uses the X-13ARIMA-SEATS software with specific options tailored to each series. Seasonal factors are updated annually, and the entire historical series is revised each year to incorporate new data and updated factors.
Why annual values fluctuate
Raw economic data exhibit strong seasonal patterns due to recurring events: weather, holidays, school calendars, and business cycles. For example, employment typically rises in the spring as construction and tourism ramp up, falls in January after holiday retail layoffs, and surges in November–December for temporary holiday hiring. These fluctuations can obscure the underlying trend. Seasonal adjustment removes these predictable effects, allowing analysts to compare month-to-month changes meaningfully. Without adjustment, a January-to-February employment gain might appear large simply because January is a low-employment month, not because of genuine economic growth.
Regional variation
Seasonal patterns vary significantly by industry and geography. The table below shows the seasonal factors for selected industries in March 2025, illustrating how the adjustment differs. A factor above 1.0 means the raw data are typically above the trend in that month; below 1.0 means below trend.
| Industry | Seasonal Factor (March 2025) |
|---|---|
| Construction | 0.92 |
| Retail trade | 0.98 |
| Leisure and hospitality | 0.95 |
| Government | 1.02 |
| Manufacturing | 0.99 |
Source: U.S. Bureau of Labor Statistics, CES seasonal factors. Factors are approximate and rounded. Construction has a low factor in March because building activity is still subdued in many regions, while government employment is relatively stable.
Meaning and limitations
Seasonally adjusted data provide a clearer view of the underlying trend by removing predictable seasonal noise. However, they are estimates subject to revision. Limitations include:
- Revisions: Seasonal factors are recalculated annually, and historical data can change. The pandemic disrupted seasonal patterns, making factors less reliable.
- Model dependence: Different methods (e.g., X-13 vs. TRAMO/SEATS) can yield slightly different results.
- Residual seasonality: Some seasonal effects may remain if patterns change rapidly.
- Not a forecast: Seasonal adjustment does not predict future values; it only removes past regularities.
Users should always consider whether seasonally adjusted or not seasonally adjusted data are more appropriate for their analysis. For example, businesses planning holiday staffing may prefer not adjusted data.
Next expected update
The next Employment Situation report, covering April 2025 data, is scheduled for release on May 2, 2025. The BLS publishes the report on the first Friday of each month, with preliminary estimates for the reference month and revisions for the prior two months. Annual seasonal factor updates are typically released with the January report.
Downloadable chart or table
The table below shows recent monthly seasonally adjusted and not seasonally adjusted total nonfarm employment levels. The full dataset can be downloaded from the BLS website at https://www.bls.gov/ces/.
| Month | Not Seasonally Adjusted (thousands) | Seasonally Adjusted (thousands) |
|---|---|---|
| Mar 2025 | 159,200 | 159,744 |
| Feb 2025 | 158,100 | 159,516 |
| Jan 2025 | 157,200 | 159,288 |
| Dec 2024 | 159,800 | 159,200 |
| Nov 2024 | 160,100 | 159,000 |
| Oct 2024 | 159,900 | 158,800 |
Note: Not seasonally adjusted values are rounded to the nearest 100,000 for simplicity. Actual BLS data are published to the nearest thousand. Source: U.S. Bureau of Labor Statistics, Employment Situation, April 4, 2025.
FAQ
Why is seasonal adjustment necessary?
Many economic time series exhibit regular seasonal patterns due to weather, holidays, and institutional schedules. These fluctuations can mask the true underlying trend. Seasonal adjustment removes these predictable effects, allowing for meaningful month-to-month comparisons and a clearer assessment of economic conditions.
How often are seasonal factors updated?
At the U.S. Bureau of Labor Statistics, seasonal factors for employment data are typically updated once a year, with the release of the January Employment Situation report. The entire historical series is revised to incorporate the new factors. In some cases, factors may be updated more frequently if there are significant disruptions, such as the COVID-19 pandemic.
Does seasonal adjustment affect all data series?
No. Seasonal adjustment is applied only to series that exhibit stable and predictable seasonal patterns. Some series, like interest rates or stock prices, generally do not have strong seasonal components and are not adjusted. Additionally, not seasonally adjusted data remain available for users who need to analyze seasonal effects.
References
- U.S. Bureau of Labor Statistics, Employment Situation – March 2025, released April 4, 2025. https://www.bls.gov/news.release/empsit.nr0.htm
- U.S. Census Bureau, X-13ARIMA-SEATS Seasonal Adjustment Program. https://www.census.gov/data/software/x13as.html
- U.S. Bureau of Labor Statistics, Seasonal Adjustment Methodology. https://www.bls.gov/ces/seasonal-adjustment-methodology.htm
- U.S. Bureau of Labor Statistics, Current Employment Statistics – CES (National). https://www.bls.gov/ces/
- Findley, D. F., Monsell, B. C., Bell, W. R., Otto, M. C., & Chen, B. C. (1998). New Capabilities and Methods of the X-12-ARIMA Seasonal-Adjustment Program. Journal of Business & Economic Statistics, 16(2), 127–152.