In brief
At a glance
Quick Facts
- Current figure
- Approximately 5,950 (50-day SMA of S&P 500)
- Measurement date
- March 7, 2025
- Previous figure
- Approximately 5,980 on February 7, 2025
- Change
- -30 points (-0.5%)
- Data source
- Yahoo Finance / S&P Dow Jones Indices
- Next update
- Daily, next on March 10, 2025
Current figure
As of March 7, 2025, the 50-day simple moving average (SMA) of the S&P 500 index was approximately 5,950, according to data from Yahoo Finance. This figure represents the average closing price of the S&P 500 over the previous 50 trading days, providing a smoothed trend line that filters out day-to-day noise.
Measurement date
The current figure refers to the 50-day SMA calculated on March 7, 2025, the last trading day of that week. The moving average is updated daily after market close, as each new closing price is added and the oldest price from 50 days ago is dropped. The underlying S&P 500 closing price on that date was 5,770.20, according to Yahoo Finance.
Previous figure
One month earlier, on February 7, 2025, the 50-day SMA of the S&P 500 was approximately 5,980, based on Yahoo Finance data. This represents a decrease of about 30 points, or a decline of roughly 0.5% over the period. The change reflects the index’s pullback from its January 2025 all-time high of 6,118.71, which pushed the moving average lower as recent lower closes replaced higher ones in the calculation window.
Long-term trend
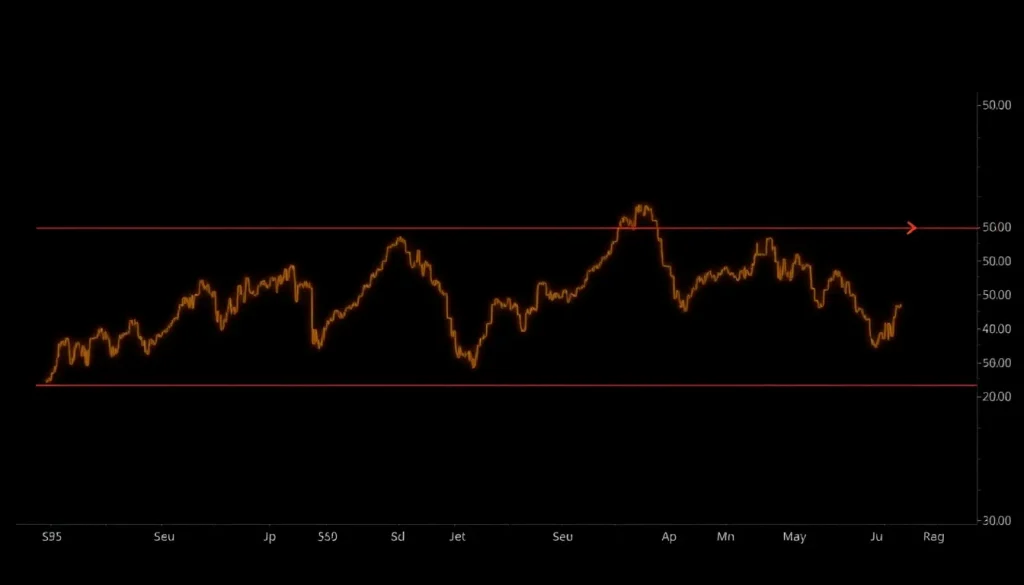
Over the past year, the 50-day SMA of the S&P 500 has generally trended upward, mirroring the bull market that began in October 2022. The moving average rose from around 4,500 in March 2024 to above 6,000 in early 2025, before easing slightly. The table below shows selected historical values of the 50-day SMA, sourced from Yahoo Finance (approximate values).
| Date | 50-Day SMA (approx.) |
|---|---|
| March 7, 2025 | 5,950 |
| January 3, 2025 | 6,020 |
| October 4, 2024 | 5,700 |
| July 5, 2024 | 5,450 |
| April 5, 2024 | 5,200 |
| January 5, 2024 | 4,700 |
Data source
The primary data source for the S&P 500 index and its moving averages is Yahoo Finance (finance.yahoo.com), which provides daily historical prices. The S&P 500 index itself is maintained by S&P Dow Jones Indices. For official index values, one can also consult the S&P Dow Jones Indices website or the Federal Reserve Economic Data (FRED) database. The moving average is a derived indicator calculated from the index’s closing prices.
Methodology
A simple moving average (SMA) is calculated by summing the closing prices of an asset over a specified number of periods (e.g., 50 days) and then dividing by that number. For the 50-day SMA, each day the oldest price is dropped and the newest price is added, so the average “moves” forward. The formula is: SMA = (P1 + P2 + … + Pn) / n, where P is the closing price and n is the number of periods. Other types include the exponential moving average (EMA), which gives more weight to recent prices, and the weighted moving average (WMA). The 50-day SMA is widely used by traders to identify intermediate-term trends. It is not seasonally adjusted and is based solely on market data.
Why annual values fluctuate
The 50-day SMA fluctuates because it is directly tied to the underlying index’s price movements. When the S&P 500 experiences a sustained rally, the moving average rises; during a correction, it falls. The rate of change depends on the magnitude of recent price changes relative to the prices being dropped from the calculation. For example, a sharp drop in the index will pull the SMA down more quickly if the prices being removed were significantly lower. External factors such as changes in interest rates, corporate earnings, geopolitical events, and economic data releases drive the index’s price, and thus the moving average.
Regional variation
Moving averages are applied to financial indices worldwide, but the specific values vary by market. The table below compares the 50-day SMA of major global stock indices as of March 7, 2025, using data from Yahoo Finance and Investing.com (approximate values).
| Index | 50-Day SMA (approx.) |
|---|---|
| S&P 500 (US) | 5,950 |
| FTSE 100 (UK) | 8,600 |
| Nikkei 225 (Japan) | 38,500 |
| Euro Stoxx 50 (Eurozone) | 5,200 |
| Shanghai Composite (China) | 3,300 |
These figures reflect the different price levels and trends in each market. The moving average is a relative tool; its absolute value is less meaningful than its relationship to the current price and its direction.
Meaning and limitations
A moving average helps identify the direction of a trend and potential support or resistance levels. When the price is above its moving average, the trend is considered bullish; below, bearish. Crossovers of short-term and long-term moving averages (e.g., 50-day and 200-day) are used as trading signals. However, moving averages are lagging indicators—they are based on past data and may give late signals. They work poorly in choppy, sideways markets and can produce false signals. The choice of period (50-day, 200-day) is arbitrary and may not suit all assets. Additionally, the SMA treats all data points equally, which may not reflect the most recent market sentiment.
Next expected update
The 50-day SMA of the S&P 500 is updated daily after the market closes (typically 4:00 PM Eastern Time). The next update will be on the following trading day, March 10, 2025. Official index values are published by S&P Dow Jones Indices and disseminated through financial data platforms like Yahoo Finance and Bloomberg.
Downloadable chart or table
The table below provides key historical data points for the S&P 500 50-day SMA. The full dataset can be downloaded from Yahoo Finance by accessing the historical data section for the S&P 500 (^GSPC) and calculating the moving average, or from FRED (series SP500) and applying a 50-day moving average transformation.
| Date | S&P 500 Close | 50-Day SMA (approx.) |
|---|---|---|
| March 7, 2025 | 5,770.20 | 5,950 |
| February 7, 2025 | 6,025.00 | 5,980 |
| January 3, 2025 | 5,942.47 | 6,020 |
| October 4, 2024 | 5,751.07 | 5,700 |
| July 5, 2024 | 5,567.19 | 5,450 |
FAQ
What is a moving average used for?
A moving average is used to smooth out price data and identify the direction of a trend. It helps traders and analysts filter out noise and spot potential support and resistance levels. Common applications include generating buy/sell signals when price crosses the moving average or when two moving averages cross.
What is the difference between a simple moving average and an exponential moving average?
A simple moving average (SMA) calculates the average of prices over a period, giving equal weight to each data point. An exponential moving average (EMA) assigns greater weight to more recent prices, making it more sensitive to new information and faster to react to price changes.
Why is the 50-day moving average important?
The 50-day moving average is widely watched by traders and investors as a measure of the intermediate-term trend. It often acts as a support level in uptrends and resistance in downtrends. Many institutional investors use it to gauge market health and make allocation decisions.
References
- Yahoo Finance - S&P 500 Historical Data (^GSPC)
- S&P Dow Jones Indices - S&P 500 Index Methodology
- Federal Reserve Economic Data (FRED) - S&P 500 (SP500)
- Investopedia - Moving Average Definition and Examples
- CME Group - Understanding Moving Averages