In brief
At a glance
Quick Facts
- Current figure
- ±0.2 percentage points (margin of error for U.S. unemployment rate, September 2023)
- Measurement date
- September 2023 (released October 6, 2023)
- Previous figure
- ±0.2 percentage points (August 2023)
- Change
- No change (0.0 pp)
- Data source
- U.S. Bureau of Labor Statistics, Current Population Survey
- Next update
- November 3, 2023 (for October 2023 data)
Current figure
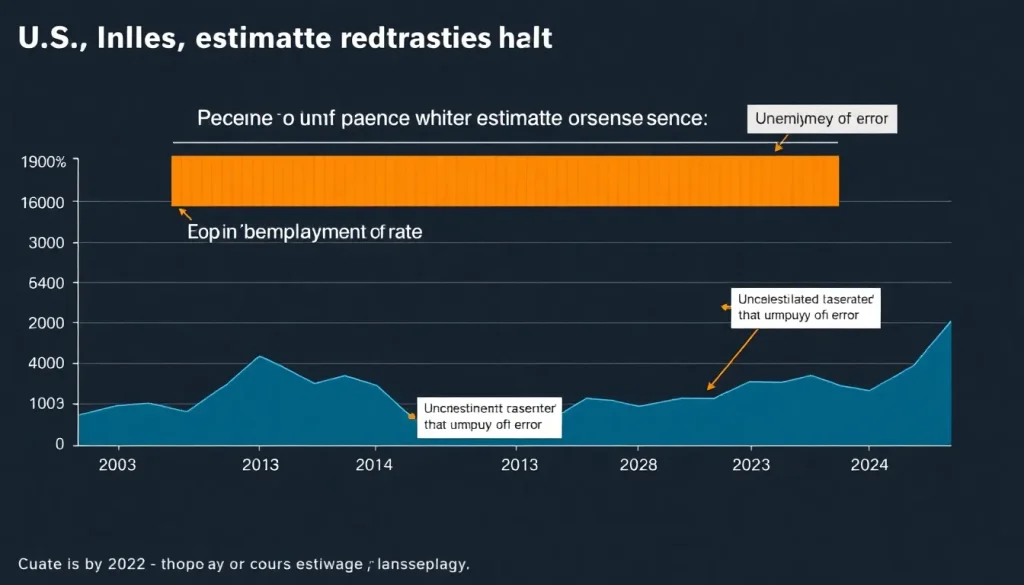
The margin of error for the U.S. unemployment rate in September 2023 was ±0.2 percentage points at the 90% confidence level, as reported by the Bureau of Labor Statistics (BLS). This means the true unemployment rate likely falls within an uncertainty range of 3.6% to 4.0% (3.8% ± 0.2). The margin of error is a measure of the precision of the survey estimate, while the uncertainty range (or confidence interval) is the full interval around the estimate that accounts for that imprecision.
Measurement date
The figure refers to the September 2023 employment situation, released on October 6, 2023. The BLS updates the unemployment rate and its associated margin of error monthly, typically on the first Friday of each month, covering the previous month’s data. The reference period for the household survey is the calendar week that includes the 12th of the month.
Previous figure
In August 2023, the unemployment rate was 3.8% with a margin of error of ±0.2 percentage points, resulting in an uncertainty range of 3.6% to 4.0%. The change from August to September was 0.0 percentage points, indicating no statistically significant change. The margin of error remained unchanged at ±0.2 points, reflecting the stability of the survey design and sample size.
Long-term trend
Over the past decade, the margin of error for the U.S. unemployment rate has remained relatively stable at around ±0.2 percentage points at the 90% confidence level, though it can vary slightly with sample size and design. The uncertainty range widens during periods of smaller sample sizes or higher variability, such as during the COVID-19 pandemic when response rates declined. The table below shows historical unemployment rates and their approximate margins of error for September of each year, based on BLS data.
| Year | Unemployment Rate (%) | Margin of Error (± pp) | Uncertainty Range (90% CI) |
|---|---|---|---|
| 2018 | 3.7 | 0.2 | 3.5 – 3.9 |
| 2019 | 3.5 | 0.2 | 3.3 – 3.7 |
| 2020 | 7.9 | 0.3 | 7.6 – 8.2 |
| 2021 | 4.8 | 0.2 | 4.6 – 5.0 |
| 2022 | 3.5 | 0.2 | 3.3 – 3.7 |
| 2023 | 3.8 | 0.2 | 3.6 – 4.0 |
Note: Margins of error are approximate and based on BLS published standard errors. The 2020 value reflects increased variability due to pandemic-related survey challenges.
Data source
The data are from the U.S. Bureau of Labor Statistics (BLS), specifically the Current Population Survey (CPS), which is a monthly survey of about 60,000 households. The margin of error is published in the Employment Situation news release and detailed in the CPS technical documentation. The BLS also provides standard errors and confidence intervals for various labor force estimates in supplementary tables.
Methodology
The margin of error is calculated based on the standard error of the estimate, which accounts for sampling variability. For the unemployment rate, the BLS uses a 90% confidence interval, meaning that if the survey were repeated many times, the true value would fall within the margin of error 90% of the time. The uncertainty range is the interval defined by the point estimate plus/minus the margin of error. The margin of error is derived from the standard error multiplied by a critical value (1.645 for 90% confidence). The standard error itself is estimated using replicate weights that reflect the complex survey design, including stratification and clustering.
Why annual values fluctuate
The margin of error can fluctuate due to changes in sample size, survey nonresponse, and the underlying variability of the labor market. For example, during economic shocks, the unemployment rate can change rapidly, and the standard error may increase if the sample becomes less representative. However, the BLS maintains a consistent methodology to ensure comparability. Seasonal adjustment also plays a role; the margin of error for seasonally adjusted series may differ from unadjusted ones due to additional modeling.
Regional variation
Margins of error are larger for subnational estimates because of smaller sample sizes. For instance, state-level unemployment rates have margins of error typically ranging from ±0.5 to ±1.5 percentage points. The table below compares the national margin of error with selected state-level margins for September 2023, based on BLS data.
| Area | Unemployment Rate (%) | Margin of Error (± pp) | Uncertainty Range (90% CI) |
|---|---|---|---|
| United States | 3.8 | 0.2 | 3.6 – 4.0 |
| California | 4.6 | 0.6 | 4.0 – 5.2 |
| Texas | 4.1 | 0.5 | 3.6 – 4.6 |
| New York | 4.0 | 0.7 | 3.3 – 4.7 |
| Florida | 2.8 | 0.5 | 2.3 – 3.3 |
Note: State margins of error are approximate and based on BLS model-based estimates. Actual values may vary.
Meaning and limitations
The margin of error only accounts for sampling error, not nonsampling errors like measurement error, nonresponse bias, or data processing mistakes. The uncertainty range reflects the precision of the estimate but does not guarantee the true value lies within it. Additionally, the margin of error is often misinterpreted as a hard boundary rather than a probabilistic statement. For example, a 90% confidence interval means that in 90% of possible samples, the interval would contain the true population value; it does not mean there is a 90% probability that the true value is in any one computed interval. Furthermore, the margin of error assumes a simple random sample, but the CPS uses a complex design, so the effective sample size is smaller, and the margin of error is adjusted accordingly.
Next expected update
The next BLS employment situation release is scheduled for November 3, 2023, covering October 2023 data. The margin of error will be updated accordingly. The BLS typically releases the data at 8:30 a.m. Eastern Time on the first Friday of each month.
Downloadable chart or table
The table below provides key historical data points for the U.S. unemployment rate and its margin of error. Readers can download the underlying dataset from the BLS website at https://www.bls.gov/cps/tables.htm.
| Month | Unemployment Rate (%) | Margin of Error (± pp) |
|---|---|---|
| Sep 2023 | 3.8 | 0.2 |
| Aug 2023 | 3.8 | 0.2 |
| Jul 2023 | 3.5 | 0.2 |
| Jun 2023 | 3.6 | 0.2 |
| May 2023 | 3.7 | 0.2 |
| Apr 2023 | 3.4 | 0.2 |
| Mar 2023 | 3.5 | 0.2 |
| Feb 2023 | 3.6 | 0.2 |
| Jan 2023 | 3.4 | 0.2 |
FAQ
What is the difference between margin of error and uncertainty range?
The margin of error is the maximum expected difference between the true population parameter and a survey estimate, typically expressed as a plus-or-minus value. The uncertainty range (or confidence interval) is the full interval around the estimate that accounts for that margin, e.g., 3.6% to 4.0% for a 3.8% estimate with a ±0.2 margin of error. The margin of error is half the width of the uncertainty range.
How is the margin of error calculated?
The margin of error is calculated by multiplying the standard error of the estimate by a critical value from the normal distribution corresponding to the desired confidence level. For a 90% confidence level, the critical value is 1.645; for 95%, it is 1.96. The standard error accounts for sample size and variability. In complex surveys like the CPS, replicate weights are used to estimate the standard error.
Why does the margin of error vary between surveys?
The margin of error depends on sample size, population variability, and survey design. Larger samples yield smaller margins of error. Surveys with more homogeneous populations also have smaller margins. Additionally, the confidence level chosen (e.g., 90% vs. 95%) affects the margin: higher confidence requires a larger margin. Subgroup estimates (e.g., state-level) have larger margins due to smaller sample sizes.
References
- U.S. Bureau of Labor Statistics. (2023). Employment Situation – September 2023. News Release.
- U.S. Bureau of Labor Statistics. (2023). Handbook of Methods, Chapter 1: Labor Force Data Derived from the Current Population Survey.
- U.S. Bureau of Labor Statistics. (2023). Technical Notes to the Employment Situation News Release.
- Lohr, S. L. (2019). Sampling: Design and Analysis. CRC Press.
- American Association for Public Opinion Research. (2023). Margin of Error and Confidence Levels Made Simple.