In brief
At a glance
Quick Facts
- Number of boundaries crossed
- 6 out of 9 (as of 2023)
- First assessment year
- 2009 (Rockström et al.)
- Most recent update
- 2023 (Richardson et al.)
- Boundaries within safe zone
- Stratospheric ozone depletion, ocean acidification (approaching), atmospheric aerosol loading (not globally quantified)
- Key driver
- Human activities during the Great Acceleration
Current status
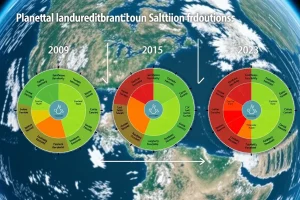
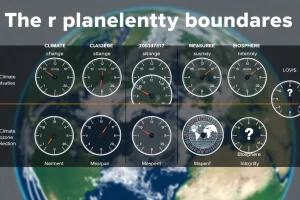
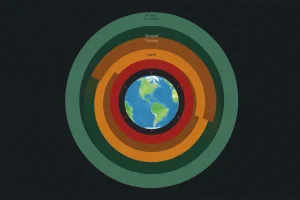
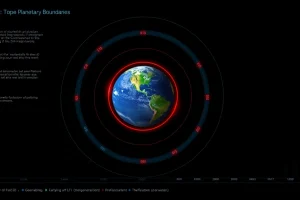
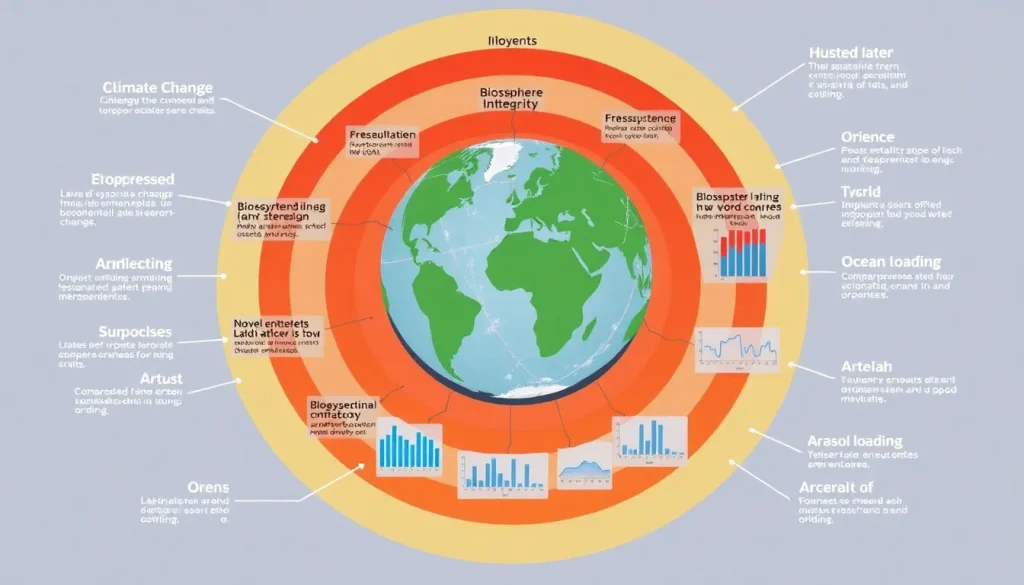
The planetary boundaries framework identifies nine Earth-system processes that regulate the stability and resilience of the Holocene-like state. As of the most recent comprehensive assessment (Richardson et al., 2023), six of these nine boundaries have been transgressed, meaning humanity is operating outside the safe operating space for those processes. The transgressed boundaries are: climate change, biosphere integrity (both genetic diversity and functional integrity), land-system change, freshwater change, biogeochemical flows (nitrogen and phosphorus), and novel entities (including synthetic chemicals and plastics). Stratospheric ozone depletion remains within the safe zone, though regional anomalies persist. Ocean acidification is still within the boundary but approaching it. Atmospheric aerosol loading is not yet quantified at the global scale, but regional transgressions are evident, particularly over South Asia. The following table summarises the status of each boundary.
| Planetary Boundary | Control Variable(s) | Proposed Safe Boundary | Current Value (approx.) | Status |
|---|---|---|---|---|
| Climate Change | Atmospheric CO₂ concentration; radiative forcing | 350 ppm CO₂; +1.0 W/m² | ~420 ppm CO₂; ~2.9 W/m² (2023) | Transgressed |
| Biosphere Integrity (Genetic Diversity) | Extinction rate (E/MSY) | <10 E/MSY | >100 E/MSY | Transgressed |
| Biosphere Integrity (Functional Integrity) | Human Appropriation of Net Primary Production (HANPP); Biodiversity Intactness Index (BII) | HANPP 90% | HANPP ~30%; BII ~79% (global average) | Transgressed |
| Land-System Change | Global forest area remaining relative to potential forest cover | 75% of potential forest cover | ~60% (global forest area) | Transgressed |
| Freshwater Change | Blue water consumption; streamflow deviation | Blue water: <10% of mean monthly flow; streamflow: <20% deviation | Blue water: ~18% of global land area exceeds boundary; streamflow: ~31% exceeds | Transgressed |
| Biogeochemical Flows (Nitrogen) | Industrial and intentional biological N fixation | 62 Tg N/year | ~150 Tg N/year | Transgressed |
| Biogeochemical Flows (Phosphorus) | P flow from freshwater to ocean; P applied to agricultural land | 11 Tg P/year (ocean); 6.2 Tg P/year (land) | ~22 Tg P/year (ocean); ~14 Tg P/year (land) | Transgressed |
| Novel Entities | Percentage of synthetic chemicals released without safety testing; plastics production | 0% untested releases; regional boundary for plastics not yet defined | Large fraction untested; >400 Mt plastics/year | Transgressed |
| Stratospheric Ozone Depletion | Stratospheric ozone concentration (Dobson Units) | <5% reduction from preindustrial (275 DU) | ~3% reduction globally; Antarctic ozone hole seasonal | Within safe zone |
| Ocean Acidification | Surface aragonite saturation state (Ωarag) | ≥80% of preindustrial Ωarag | ~85% of preindustrial (global mean) | Approaching boundary |
| Atmospheric Aerosol Loading | Aerosol optical depth (AOD); regional monsoon disruption | Global AOD not defined; regional AOD <0.1 (South Asia) | Regional AOD >0.3 over South Asia | Not quantified globally; regional transgression |
Control variable
Each planetary boundary is tracked by one or more control variables—measurable quantities that reflect the state of the Earth-system process. For climate change, the primary control variable is atmospheric CO₂ concentration, supplemented by total anthropogenic radiative forcing. Biosphere integrity uses extinction rate (genetic diversity) and the Biodiversity Intactness Index or Human Appropriation of Net Primary Production (functional integrity). Land-system change is monitored via the percentage of global potential forest cover remaining. Freshwater change employs blue water consumption and streamflow deviation from preindustrial conditions. Biogeochemical flows are split into nitrogen (industrial and intentional biological fixation) and phosphorus (flow to oceans and application to soils). Novel entities are assessed by the fraction of synthetic chemicals released without adequate safety testing and the volume of plastics production. Stratospheric ozone depletion uses column ozone concentration, ocean acidification uses surface aragonite saturation state, and atmospheric aerosol loading uses aerosol optical depth, though a global boundary remains undefined.
Proposed boundary or threshold
The proposed safe boundaries are derived from Earth-system science, paleoclimatic data, and ecosystem resilience theory. For climate change, the boundary is set at 350 ppm CO₂ and +1.0 W/m² radiative forcing, corresponding to a long-term temperature rise of ~1°C above preindustrial. The genetic diversity boundary is an extinction rate of less than 10 extinctions per million species-years (E/MSY). Functional integrity boundaries are HANPP below 10% of preindustrial net primary production and BII above 90%. Land-system change requires at least 75% of potential forest cover remaining globally. Freshwater boundaries are defined as blue water consumption below 10% of mean monthly river flow and streamflow deviation less than 20% in any month. Biogeochemical nitrogen flow should not exceed 62 Tg N/year, while phosphorus flow to oceans should stay below 11 Tg P/year and P application to erodible soils below 6.2 Tg P/year. For novel entities, the boundary is zero release of untested synthetic chemicals. Stratospheric ozone depletion should not exceed a 5% reduction from preindustrial levels. Ocean acidification requires surface aragonite saturation to remain at or above 80% of preindustrial values. A global aerosol loading boundary has not been set, but regional thresholds for monsoon disruption are proposed at aerosol optical depth <0.1.
Current measured value
Atmospheric CO₂ concentration reached approximately 420 ppm in 2023, far exceeding the 350 ppm boundary. The extinction rate is estimated at over 100 E/MSY, an order of magnitude above the safe limit. HANPP is around 30% of preindustrial NPP, and global BII has fallen to about 79%. Global forest cover stands at roughly 60% of potential, well below the 75% threshold. Blue water consumption exceeds the boundary on 18% of the global land area, and streamflow deviation exceeds the boundary on 31% of land area. Industrial nitrogen fixation is about 150 Tg N/year, more than double the boundary. Phosphorus flow to oceans is around 22 Tg P/year, and P application to land is about 14 Tg P/year, both beyond safe limits. Novel entities are widely released without testing, and plastic production exceeds 400 million tonnes annually. Stratospheric ozone has recovered to about 3% below preindustrial globally, within the safe zone. Ocean surface aragonite saturation is about 85% of preindustrial, approaching the 80% threshold. Regional aerosol optical depth over South Asia often exceeds 0.3, indicating transgression at sub-global scales.
How the boundary is calculated
Boundary values are determined through a combination of Earth-system modeling, paleo-records, and expert judgment. For climate change, the 350 ppm CO₂ boundary is based on paleoclimate evidence from the Pliocene and the need to avoid ice sheet destabilization. Biosphere integrity boundaries rely on fossil records of background extinction rates and global vegetation models. Land-system change uses simulations of climate and moisture feedbacks from deforestation. Freshwater boundaries are derived from hydrological models that assess environmental flow requirements. Biogeochemical flow boundaries are calculated from global nutrient cycle models and the eutrophication thresholds of aquatic ecosystems. Novel entities are assessed through chemical safety data and production volumes. Ozone depletion is monitored via satellite and ground-based instruments, with the boundary set from preindustrial ozone levels. Ocean acidification uses projections of CO₂ uptake and carbonate chemistry. Aerosol loading is estimated from satellite retrievals and climate models, though a global boundary remains elusive due to the spatially heterogeneous nature of aerosols.
Historical trend
Since the Industrial Revolution, all control variables have moved away from their Holocene baselines. Atmospheric CO₂ has risen from ~280 ppm to over 420 ppm. The extinction rate has accelerated to 100–1000 times the background rate. Global forest cover has declined from over 80% of potential to about 60%. Human water consumption has increased sixfold since 1900. Industrial nitrogen fixation has grown from near zero to 150 Tg N/year. Phosphorus mining and fertilizer use have increased dramatically since the mid-20th century. Synthetic chemical production and plastic waste have surged since the 1950s. In contrast, stratospheric ozone depletion peaked in the 1990s and is now recovering due to the Montreal Protocol. Ocean acidification has steadily increased as CO₂ dissolves in seawater. Aerosol loading rose during industrialization but has declined in some regions due to air quality regulations, while remaining high in others. The number of transgressed boundaries has increased from three in the 2009 assessment (climate, biodiversity loss, nitrogen cycle) to six in 2023.
What is driving the change
The primary driver of boundary transgression is the scale of human activity—the Great Acceleration. Fossil fuel combustion, industrial agriculture, deforestation, water extraction, and chemical production are the main proximate causes. Population growth and rising per capita consumption amplify these pressures. Climate change is driven by greenhouse gas emissions from energy, industry, and land use. Biosphere integrity loss is driven by habitat destruction, overexploitation, pollution, and climate change. Land-system change is driven by agricultural expansion, urbanization, and logging. Freshwater change results from irrigation, dam construction, and groundwater depletion. Biogeochemical flows are dominated by synthetic fertilizer production and fossil fuel combustion. Novel entities stem from the vast and growing chemical industry, with inadequate regulation and waste management. Ozone depletion was driven by chlorofluorocarbons, now phased out. Ocean acidification is a direct consequence of rising atmospheric CO₂. Aerosol loading is driven by fossil fuel and biomass burning.
What crossing the boundary means
Transgressing a planetary boundary increases the risk of triggering non-linear, abrupt, or irreversible Earth-system changes. For climate change, crossing the boundary raises the likelihood of ice sheet collapse, permafrost thaw, and shifts in ocean circulation. Biosphere integrity transgression undermines ecosystem functioning, pollination, and carbon sequestration. Land-system change beyond the boundary can disrupt regional rainfall patterns and accelerate biodiversity loss. Freshwater boundary transgression threatens aquatic ecosystems and water security. Excess nitrogen and phosphorus cause widespread eutrophication, dead zones, and harmful algal blooms. Novel entities pose toxicological risks and may disrupt biogeochemical cycles. While ozone depletion has been largely reversed, its transgression in the 1980s–1990s increased UV radiation and health risks. Ocean acidification approaching the boundary endangers calcifying organisms and marine food webs. Regional aerosol transgression can weaken monsoons and affect crop yields. The interactions among boundaries amplify risks, potentially pushing the Earth system into a new, less hospitable state.
Regional variations
Several boundaries operate at sub-global scales, and their transgression is regionally heterogeneous. Freshwater change is highly localized: some basins (e.g., Colorado, Indus, Yellow River) are severely over-appropriated, while others remain within limits. Land-system change is most acute in tropical regions, where deforestation for agriculture is concentrated. Biogeochemical flows show hotspots of nitrogen and phosphorus pollution in agricultural regions of North America, Europe, and South and East Asia. Aerosol loading is regionally concentrated, with South Asia and East Asia experiencing the highest levels, affecting monsoon dynamics. Biosphere integrity loss is global but most severe in biodiversity hotspots. Climate change, though global in driver, manifests regionally through amplified warming in the Arctic and altered precipitation patterns. Ocean acidification is more pronounced in high-latitude and upwelling regions. The regional nature of many boundaries implies that local actions can be effective in returning to safe conditions, but also that global aggregation may mask local transgressions.
Interaction with other boundaries
Planetary boundaries are tightly coupled. Climate change exacerbates biosphere integrity loss through habitat shifts and extreme events. Deforestation (land-system change) contributes to climate change and reduces the land carbon sink. Freshwater overuse can amplify land-system change and reduce ecosystem resilience. Excess nitrogen and phosphorus runoff contributes to freshwater eutrophication and coastal dead zones, while also affecting climate through nitrous oxide emissions. Novel entities, such as microplastics, can interact with biogeochemical cycles and biosphere integrity. Aerosol loading can mask some greenhouse warming but disrupts regional hydrology. Ocean acidification and climate change jointly stress marine ecosystems. These interactions mean that transgressing one boundary can push others further into the danger zone, creating cascading risks. Conversely, addressing one boundary (e.g., reforestation) can have co-benefits for climate, biodiversity, and freshwater regulation.
Impacts on people and ecosystems
The transgression of multiple boundaries already has tangible consequences. Climate change increases the frequency and intensity of heatwaves, floods, droughts, and storms, affecting food security and human health. Biosphere integrity loss reduces pollination services, pest control, and the provision of wild foods and medicines. Land-system change contributes to soil degradation, loss of livelihoods, and increased zoonotic disease risk. Freshwater boundary transgression leads to water scarcity, affecting billions of people and aquatic biodiversity. Nutrient pollution causes toxic algal blooms, fish kills, and contamination of drinking water. Novel entities, including endocrine-disrupting chemicals and microplastics, pose emerging health risks. Ocean acidification threatens fisheries and coral reef tourism. Aerosol pollution contributes to millions of premature deaths annually from respiratory diseases. The combined effects disproportionately impact vulnerable populations, including low-income communities and Indigenous peoples, and undermine progress toward the Sustainable Development Goals.
Possible pathways back toward the safe zone
Returning to the safe operating space requires transformative changes across multiple sectors. For climate change, rapid decarbonization through renewable energy, energy efficiency, and carbon removal is essential. Biosphere integrity can be restored by expanding protected areas, restoring degraded ecosystems, and adopting sustainable agriculture and forestry. Land-system change can be reversed through reforestation, agroforestry, and reducing meat consumption to free up land. Freshwater boundaries can be respected by improving water-use efficiency, protecting environmental flows, and reducing pollution. Biogeochemical flows can be reduced by precision agriculture, circular nutrient management, and dietary shifts. Novel entities require green chemistry, extended producer responsibility, and international treaties to phase out hazardous substances. The success of the Montreal Protocol in reversing ozone depletion demonstrates that coordinated global action can restore a boundary. Integrated policies that address multiple boundaries simultaneously—such as nature-based solutions—offer the most efficient path back to a safe operating space.
Scientific uncertainty
Significant uncertainties remain in the planetary boundaries framework. The exact position of some boundaries is debated due to incomplete understanding of Earth-system thresholds and feedbacks. For climate change, the 350 ppm boundary is based on paleo-evidence, but the precise sensitivity of ice sheets and ecosystems is uncertain. Biosphere integrity boundaries are particularly uncertain because of limited data on functional diversity and the complex relationship between biodiversity and ecosystem resilience. The freshwater boundary is challenged by the lack of a single global control variable and the difficulty of defining environmental flows across diverse basins. Novel entities boundary is inherently hard to quantify due to the vast number of chemicals and their unknown interactions. Aerosol loading lacks a global boundary because of the opposing cooling and warming effects of different aerosol types. The interactions among boundaries introduce additional uncertainty, as models cannot fully capture cascading effects. Despite these uncertainties, the framework is widely regarded as a useful heuristic for guiding policy and precautionary action.
Criticism and alternative frameworks
The planetary boundaries concept has faced criticism for its global aggregation, which can obscure local realities, and for the difficulty of defining single thresholds for complex processes. Some scientists argue that the boundaries are too precautionary or not sufficiently grounded in empirical data. Others point out that the framework does not adequately address social and economic dimensions, such as equity and governance. Alternative frameworks include the “doughnut economics” model by Kate Raworth, which combines planetary boundaries with social foundations, and the “safe and just Earth system boundaries” developed by the Earth Commission, which incorporate justice considerations. The “planetary health” approach focuses on the human health impacts of environmental change. Despite critiques, the planetary boundaries framework remains influential in science, policy, and public discourse as a clear communication tool for Earth-system limits.
FAQ
What are planetary boundaries?
Planetary boundaries are nine Earth-system processes that regulate the stability and resilience of the planet. They define a safe operating space for humanity, beyond which the risk of destabilizing the Earth system increases significantly. The framework was first proposed in 2009 and has been updated several times, most recently in 2023.
Which planetary boundaries have been crossed?
As of the 2023 assessment, six boundaries are transgressed: climate change, biosphere integrity (genetic diversity and functional integrity), land-system change, freshwater change, biogeochemical flows (nitrogen and phosphorus), and novel entities. Stratospheric ozone depletion is within the safe zone, ocean acidification is approaching the boundary, and atmospheric aerosol loading is not yet quantified globally but is transgressed regionally.
What happens if we cross all planetary boundaries?
Crossing multiple boundaries increases the risk of triggering irreversible tipping points and cascading Earth-system changes, such as ice sheet collapse, Amazon dieback, or ocean anoxia. This could lead to a less stable and less hospitable planet, undermining food security, water availability, and human well-being. However, the exact outcomes depend on the interactions and the speed of transgression.
References
- Rockström, J., et al. (2009). A safe operating space for humanity. Nature, 461, 472–475.
- Steffen, W., et al. (2015). Planetary boundaries: Guiding human development on a changing planet. Science, 347(6223), 1259855.
- Richardson, K., et al. (2023). Earth beyond six of nine planetary boundaries. Science Advances, 9(37), eadh2458.
- Persson, L., et al. (2022). Outside the safe operating space of the planetary boundary for novel entities. Environmental Science & Technology, 56(3), 1510–1521.
- Wang-Erlandsson, L., et al. (2022). A planetary boundary for green water. Nature Reviews Earth & Environment, 3, 380–392.