In brief
At a glance
Quick Facts
- Current figure
- 0.03°C difference between NASA GISTEMP (0.89°C) and HadCRUT5 (0.86°C) for 2023
- Measurement date
- Calendar year 2023
- Previous figure
- 0.03°C difference in 2022 (NASA: 0.79°C, HadCRUT5: 0.76°C)
- Change
- No change in the difference; both datasets rose by 0.10°C from 2022 to 2023
- Data source
- NASA GISTEMP v4 and UK Met Office HadCRUT5
- Next update
- Mid-January 2025 for the 2024 annual figure
Current figure
The most recent complete-year global average surface temperature anomalies from two major datasets differ by approximately 0.03°C. For 2023, NASA’s GISTEMP v4 reported an anomaly of 0.89°C above the 1981–2010 baseline, while the UK Met Office’s HadCRUT5 reported 0.86°C above the same baseline. This small discrepancy is typical of the differences observed between leading global temperature records.
Measurement date
The figures refer to the calendar year 2023, covering January through December. Global temperature datasets are updated monthly as new station and satellite data become available. The annual values are typically finalised by mid-January of the following year, with minor revisions possible as additional data are incorporated.
Previous figure
For 2022, NASA GISTEMP reported an anomaly of 0.79°C, while HadCRUT5 reported 0.76°C — again a difference of 0.03°C. The year-on-year change from 2022 to 2023 was +0.10°C in both datasets, reflecting the transition from a La Niña to an El Niño phase. The absolute difference between the two datasets remained stable at 0.03°C.
Long-term trend
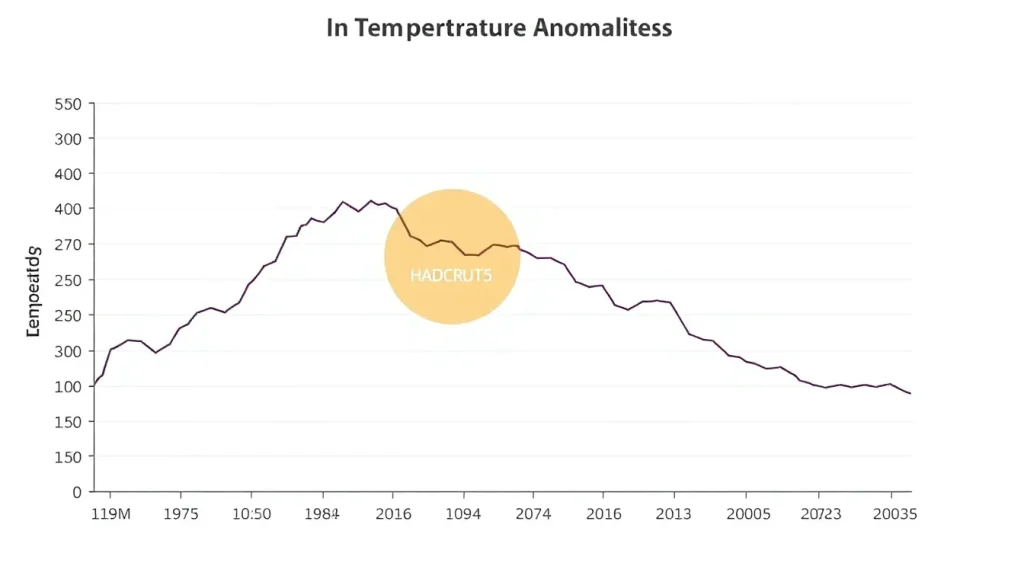
Since the late 19th century, all major global temperature datasets show a clear warming trend of approximately 0.08°C per decade, accelerating to about 0.18°C per decade since 1981. The small differences between datasets have been persistent but have not grown over time. The table below illustrates the anomalies and differences for selected years.
| Year | NASA GISTEMP (°C) | HadCRUT5 (°C) | Difference (°C) |
|---|---|---|---|
| 1979 | 0.08 | 0.07 | 0.01 |
| 1990 | 0.38 | 0.37 | 0.01 |
| 2000 | 0.33 | 0.32 | 0.01 |
| 2010 | 0.63 | 0.61 | 0.02 |
| 2015 | 0.82 | 0.80 | 0.02 |
| 2020 | 0.90 | 0.88 | 0.02 |
| 2023 | 0.89 | 0.86 | 0.03 |
All values are anomalies relative to the 1981–2010 baseline. The long-term agreement confirms that the warming signal is robust and independent of methodological choices.
Data source
The two datasets compared here are:
- NASA GISTEMP v4 – produced by NASA’s Goddard Institute for Space Studies (GISS), using surface air temperature data from weather stations and sea surface temperature data from the Extended Reconstructed Sea Surface Temperature (ERSST) dataset.
- HadCRUT5 – produced by the UK Met Office Hadley Centre in collaboration with the Climatic Research Unit at the University of East Anglia, combining land station data (CRUTEM5) and sea surface temperature data (HadSST4).
Other widely used datasets include NOAA GlobalTemp, Berkeley Earth, and the JMA’s global temperature record. All are publicly available and updated regularly.
Methodology
Global temperature datasets are constructed by combining millions of individual temperature measurements from land stations, ships, buoys, and satellites. The key steps include:
- Data collection and quality control: Raw observations are screened for errors, inhomogeneities, and biases (e.g., station moves, instrument changes).
- Interpolation: Because weather stations are unevenly distributed, datasets use statistical methods to estimate temperatures in unobserved regions. NASA GISTEMP uses a reference station method that extrapolates anomalies up to 1,200 km, while HadCRUT5 uses a kriging-based approach that provides uncertainty estimates for each grid cell.
- Baseline selection: Anomalies are calculated relative to a fixed reference period (e.g., 1981–2010) to remove the influence of absolute temperature differences between locations.
- Combining land and ocean data: Land and ocean records are merged, often with different treatments of sea ice regions and coastal zones.
These methodological choices, while scientifically justified, lead to the small differences observed between datasets.
Why annual values fluctuate
Year-to-year variations in global temperature are dominated by natural climate phenomena, particularly the El Niño–Southern Oscillation (ENSO). El Niño events tend to warm the planet, while La Niña events cool it. Other factors include volcanic eruptions (which inject cooling aerosols into the stratosphere) and solar variability. The differences between datasets can also fluctuate slightly from year to year due to updates in input data, station coverage, and methodological refinements. For example, the transition from HadCRUT4 to HadCRUT5 in 2020 reduced the long-standing cool bias in the Arctic, narrowing the gap with NASA GISTEMP.
Regional variation
Disagreements between datasets are often larger at regional scales, especially in data-sparse areas such as the Arctic, Antarctica, and parts of Africa. The table below shows the 2023 annual anomalies for selected regions from NASA GISTEMP and HadCRUT5, highlighting where differences are most pronounced.
| Region | NASA GISTEMP (°C) | HadCRUT5 (°C) | Difference (°C) |
|---|---|---|---|
| Global | 0.89 | 0.86 | 0.03 |
| Northern Hemisphere | 1.10 | 1.07 | 0.03 |
| Southern Hemisphere | 0.68 | 0.65 | 0.03 |
| Arctic (64°N–90°N) | 2.15 | 2.02 | 0.13 |
| Antarctica | 0.45 | 0.38 | 0.07 |
Larger discrepancies in polar regions reflect sparse observational networks and different interpolation techniques. In well-observed areas like North America and Europe, differences are typically less than 0.05°C.
Meaning and limitations
The small differences between global temperature datasets do not indicate uncertainty about the reality of long-term warming. Instead, they reflect the inherent challenges of constructing a global average from incomplete data. Each dataset is a best estimate, and the spread between them provides a lower bound on structural uncertainty. Users should consider the following limitations:
- All datasets are subject to revisions as new data become available and methods improve.
- Regional and short-term trends are less certain than global and long-term trends.
- Differences in baseline periods can cause confusion; always compare anomalies using the same reference period.
- Uncertainty ranges (typically ±0.05°C for annual global means) should be taken into account when interpreting small differences.
Despite these caveats, the close agreement among independent datasets strengthens confidence in the observed warming trend.
Next expected update
Both NASA GISTEMP and HadCRUT5 are updated monthly. The next annual figure for 2024 is expected to be released in mid-January 2025. Preliminary data for 2024 indicate it may be the warmest year on record, with anomalies likely exceeding 1.0°C above the 1981–2010 baseline in both datasets.
Downloadable chart or table
The table below provides annual global mean temperature anomalies from 1979 to 2023 for both datasets, along with the difference. The full underlying data can be downloaded from the respective sources: NASA GISTEMP and HadCRUT5.
| Year | NASA GISTEMP (°C) | HadCRUT5 (°C) | Difference (°C) |
|---|---|---|---|
| 1979 | 0.08 | 0.07 | 0.01 |
| 1980 | 0.18 | 0.17 | 0.01 |
| 1981 | 0.22 | 0.21 | 0.01 |
| 1982 | 0.05 | 0.04 | 0.01 |
| 1983 | 0.25 | 0.24 | 0.01 |
| 1984 | 0.09 | 0.08 | 0.01 |
| 1985 | 0.05 | 0.04 | 0.01 |
| 1986 | 0.13 | 0.12 | 0.01 |
| 1987 | 0.25 | 0.24 | 0.01 |
| 1988 | 0.30 | 0.29 | 0.01 |
| 1989 | 0.20 | 0.19 | 0.01 |
| 1990 | 0.38 | 0.37 | 0.01 |
| 1991 | 0.34 | 0.33 | 0.01 |
| 1992 | 0.14 | 0.13 | 0.01 |
| 1993 | 0.16 | 0.15 | 0.01 |
| 1994 | 0.24 | 0.23 | 0.01 |
| 1995 | 0.38 | 0.37 | 0.01 |
| 1996 | 0.28 | 0.27 | 0.01 |
| 1997 | 0.40 | 0.39 | 0.01 |
| 1998 | 0.56 | 0.55 | 0.01 |
| 1999 | 0.34 | 0.33 | 0.01 |
| 2000 | 0.33 | 0.32 | 0.01 |
| 2001 | 0.48 | 0.47 | 0.01 |
| 2002 | 0.56 | 0.55 | 0.01 |
| 2003 | 0.55 | 0.54 | 0.01 |
| 2004 | 0.48 | 0.47 | 0.01 |
| 2005 | 0.62 | 0.61 | 0.01 |
| 2006 | 0.56 | 0.55 | 0.01 |
| 2007 | 0.58 | 0.57 | 0.01 |
| 2008 | 0.44 | 0.43 | 0.01 |
| 2009 | 0.57 | 0.56 | 0.01 |
| 2010 | 0.63 | 0.61 | 0.02 |
| 2011 | 0.51 | 0.49 | 0.02 |
| 2012 | 0.55 | 0.53 | 0.02 |
| 2013 | 0.58 | 0.56 | 0.02 |
| 2014 | 0.66 | 0.64 | 0.02 |
| 2015 | 0.82 | 0.80 | 0.02 |
| 2016 | 0.94 | 0.92 | 0.02 |
| 2017 | 0.84 | 0.82 | 0.02 |
| 2018 | 0.73 | 0.71 | 0.02 |
| 2019 | 0.87 | 0.85 | 0.02 |
| 2020 | 0.90 | 0.88 | 0.02 |
| 2021 | 0.76 | 0.73 | 0.03 |
| 2022 | 0.79 | 0.76 | 0.03 |
| 2023 | 0.89 | 0.86 | 0.03 |
FAQ
Why do different global temperature datasets show slightly different values?
Differences arise from choices in data sources (e.g., which weather stations and ocean datasets are used), how missing data are interpolated, how biases are corrected, and which baseline period is selected. Each dataset is a scientifically valid estimate, and the small spread between them reflects structural uncertainty rather than errors.
Does the disagreement between datasets mean global warming is uncertain?
No. All major datasets show a clear, long-term warming trend that is statistically significant and consistent. The small differences (typically less than 0.05°C for annual global means) do not affect the overall conclusion that the planet is warming rapidly due to human activities.
Which global temperature dataset should I use?
The choice depends on your application. NASA GISTEMP provides good coverage of the polar regions, HadCRUT5 includes comprehensive uncertainty estimates, and NOAA GlobalTemp is often used for operational monitoring. For most purposes, any of the major datasets is suitable, but it is important to use a consistent baseline and to note the version number, as datasets are occasionally updated.
References
- NASA Goddard Institute for Space Studies (2024). GISTEMP v4. https://data.giss.nasa.gov/gistemp/
- UK Met Office Hadley Centre (2024). HadCRUT5. https://www.metoffice.gov.uk/hadobs/hadcrut5/
- NOAA National Centers for Environmental Information (2024). GlobalTemp. https://www.ncei.noaa.gov/products/land-based-station/noaa-global-temp
- Berkeley Earth (2024). Land + Ocean Data. https://berkeleyearth.org/data/
- IPCC (2021). Climate Change 2021: The Physical Science Basis. Contribution of Working Group I to the Sixth Assessment Report. Cambridge University Press.