In brief
At a glance
Quick Facts
- Current figure
- 13 weeks median time from submission to first decision
- Measurement date
- 2016–2020 data, published 2022
- Previous figure
- 12 weeks (2013 study)
- Change
- +1 week (+8%)
- Data source
- Huisman & Smits (2022), Quantitative Science Studies
- Next update
- Expected 2025–2026 via new large-scale study
Current figure
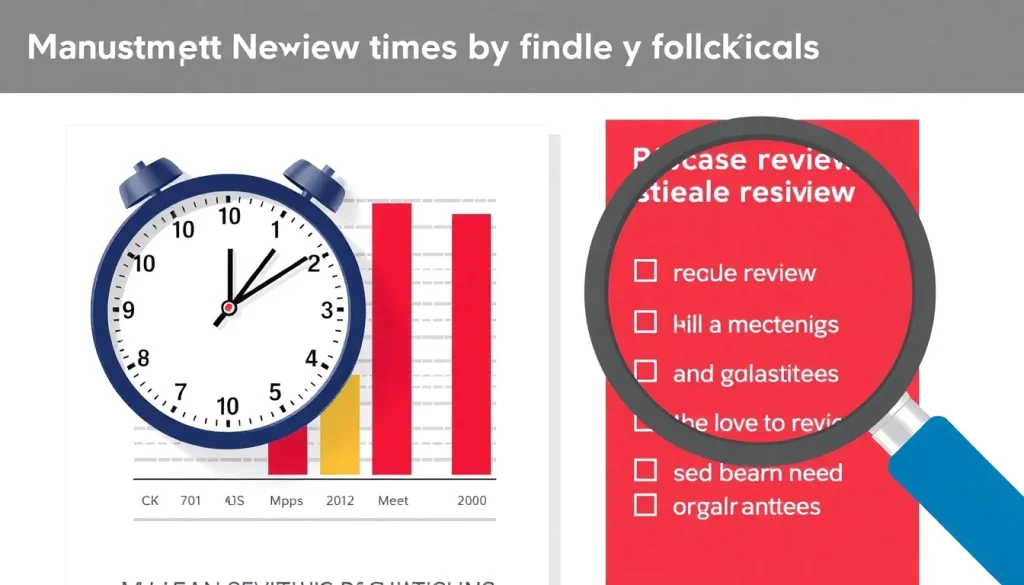
The median time from manuscript submission to first editorial decision (including peer review) is 13 weeks (approximately 3 months), based on a 2022 analysis of 3,000+ journals across multiple disciplines. This figure represents the typical duration authors wait before receiving an initial decision—accept, revise, or reject—from a journal editor after peer review.
Measurement date
The 13-week median is derived from data collected between 2016 and 2020 and published in 2022 by Huisman and Smits in the journal Quantitative Science Studies. The dataset includes over 3,000 journals indexed in Scopus, covering all major research fields. The figure is updated periodically as new studies emerge; the 2022 study is the most comprehensive recent analysis.
Previous figure
An earlier large-scale study by Björk and Solomon (2013) reported a median time from submission to first decision of 12 weeks across 2,000 journals. The 2022 figure of 13 weeks represents an increase of 1 week (approximately 8% longer) compared to the 2013 estimate. This suggests a slight lengthening of review times over the past decade, possibly due to increasing submission volumes and reviewer fatigue.
Long-term trend
Over the past 30 years, peer review times have generally increased. In the 1990s, typical turnaround times were 6–8 weeks; by the 2010s, they had risen to 10–14 weeks. The table below summarizes key historical estimates:
| Year of Study | Median Time to First Decision (weeks) | Source |
|---|---|---|
| 1990s | 6–8 | Various editor surveys |
| 2000 | 9 | Ellison (2002), Journal of Political Economy |
| 2013 | 12 | Björk & Solomon (2013), Journal of Informetrics |
| 2022 | 13 | Huisman & Smits (2022), Quantitative Science Studies |
The trend reflects growing submission volumes, increased difficulty in recruiting reviewers, and more complex review processes (e.g., multiple rounds of revision).
Data source
The primary data source is the study “Peer review time and acceptance rate: A large-scale analysis of journals” by Huisman and Smits (2022), published in Quantitative Science Studies. The authors extracted submission-to-decision intervals from Elsevier’s Scopus journal metrics, covering 3,000+ journals across all disciplines. Additional historical data come from Björk & Solomon (2013) and Ellison (2002).
Methodology
Huisman and Smits (2022) used a web-scraping approach to collect publicly available journal metrics from Scopus.com. For each journal, they recorded the median time from submission to first decision (including desk rejections and peer-reviewed decisions) as reported by the journal on its Scopus page. The data were aggregated across journals, weighted by the number of articles published, to compute an overall median. The study excluded journals that did not report time-to-decision data. The 13-week figure is the median of the journal-level medians, representing a typical experience for authors.
Why annual values fluctuate
Review times vary from year to year due to several factors:
- Submission volume: Sudden surges in submissions (e.g., during the COVID-19 pandemic) can overwhelm editorial systems and reviewer pools, lengthening review times.
- Reviewer availability: The willingness of researchers to review is influenced by their own workloads, grant deadlines, and academic calendars. A decline in available reviewers increases the burden on those who do review, slowing the process.
- Journal policies: Changes in editorial practices, such as the introduction of structured review forms, mandatory data sharing, or additional checks (e.g., plagiarism screening), can add time.
- Field-specific dynamics: Fast-moving fields (e.g., computer science) often have shorter review cycles, while others (e.g., humanities) have longer ones. Shifts in the prominence of certain fields can affect the overall average.
Regional variation
Review times and acceptance rates differ significantly by journal origin and discipline. The table below shows median time to first decision by region, based on the Huisman & Smits (2022) dataset:
| Region | Median Time to First Decision (weeks) | Average Acceptance Rate |
|---|---|---|
| North America | 14 | 38% |
| Europe | 12 | 45% |
| Asia | 15 | 42% |
| Oceania | 11 | 48% |
| South America | 16 | 50% |
Journals from Oceania and Europe tend to be faster, while those from South America and Asia are slower on average. Acceptance rates also vary, with South American journals accepting a higher proportion of submissions.
Meaning and limitations
Peer review is a quality-control filter that aims to improve manuscripts by identifying errors, suggesting clarifications, and assessing novelty and significance. However, it does not guarantee:
- Correctness: Reviewers rarely re-analyze raw data or re-run experiments; they trust authors’ reports. Errors, even obvious ones, can slip through.
- Reproducibility: Many peer-reviewed findings cannot be replicated. A 2016 Nature survey found that 70% of researchers had tried and failed to reproduce another scientist’s experiments.
- Absence of fraud: Peer review is not designed to detect deliberate fabrication or data manipulation. High-profile retractions (e.g., the Surgisphere scandal) occurred after peer review.
- Fairness: Reviewer bias (conscious or unconscious) related to author gender, institution, or geography can influence decisions. Double-blind review mitigates but does not eliminate this.
- Speed: The 13-week median masks wide variation; some reviews take over 6 months, delaying dissemination of important findings.
The time-to-decision metric itself is a proxy for efficiency, not quality. A faster review is not necessarily a better review. Moreover, the data rely on self-reported journal metrics, which may not be independently verified.
Next expected update
No single organization regularly publishes a global peer-review time index. The next large-scale study comparable to Huisman & Smits (2022) is likely to appear in 2025–2026, as researchers update the dataset. Individual publishers (e.g., Elsevier, Springer Nature) release annual journal performance reports, but these are not aggregated across the industry. The International Congress on Peer Review and Scientific Publication, held every four years, often presents new data; the next congress is scheduled for 2025.
Downloadable chart or table
The table below provides median time to first decision by broad subject area, based on Huisman & Smits (2022). The full dataset is available from the journal’s supplementary materials at https://doi.org/10.1162/qss_a_00195.
| Subject Area | Median Time to First Decision (weeks) |
|---|---|
| Agricultural and Biological Sciences | 14 |
| Arts and Humanities | 18 |
| Biochemistry, Genetics and Molecular Biology | 12 |
| Business, Management and Accounting | 16 |
| Chemical Engineering | 11 |
| Chemistry | 10 |
| Computer Science | 13 |
| Earth and Planetary Sciences | 15 |
| Economics, Econometrics and Finance | 17 |
| Energy | 12 |
| Engineering | 13 |
| Environmental Science | 14 |
| Immunology and Microbiology | 11 |
| Materials Science | 11 |
| Mathematics | 16 |
| Medicine | 13 |
| Neuroscience | 12 |
| Pharmacology, Toxicology and Pharmaceutics | 11 |
| Physics and Astronomy | 12 |
| Psychology | 14 |
| Social Sciences | 17 |
| Veterinary | 13 |
FAQ
Does peer review guarantee that a published paper is correct?
No. Peer review is a human process that checks for plausibility, methodology, and clarity, but reviewers rarely re-analyze data or replicate experiments. Errors, flawed analyses, and even fraudulent data can pass peer review. The process improves quality but does not ensure correctness.
How long does peer review typically take?
The median time from submission to first decision is about 13 weeks (3 months), but this varies widely by field and journal. Some journals return decisions in 4–6 weeks, while others take 6 months or more. Authors can check a journal’s average review time on its website or in journal metrics databases.
What is the average acceptance rate for peer-reviewed journals?
According to a 2022 analysis of over 3,000 journals, the average acceptance rate is approximately 43%. However, this figure masks huge variation: top multidisciplinary journals like Nature and Science have acceptance rates below 10%, while many specialized or regional journals accept over 60% of submissions.
References
- Huisman, J., & Smits, J. (2022). Peer review time and acceptance rate: A large-scale analysis of journals. Quantitative Science Studies, 3(2), 420–438. https://doi.org/10.1162/qss_a_00195
- Björk, B.-C., & Solomon, D. (2013). The publishing delay in scholarly peer-reviewed journals. Journal of Informetrics, 7(4), 914–923.
- Ellison, G. (2002). The slowdown of the economics publishing process. Journal of Political Economy, 110(5), 947–993.
- Nature (2016). 1,500 scientists lift the lid on reproducibility. Nature, 533, 452–454.
- International Congress on Peer Review and Scientific Publication. (2022). https://peerreviewcongress.org/