In brief
At a glance
Quick Facts
- Current figure
- ~29,200 systematic reviews published in 2019; 63% included a meta-analysis (2014 sample)
- Measurement date
- 2019 (systematic reviews); February 2014 (meta-analysis proportion)
- Previous figure
- ~5,000 systematic reviews in 2000; 53% meta-analysis proportion in 2004
- Change
- +24,200 reviews (+484%) from 2000 to 2019; +10 percentage points in meta-analysis proportion from 2004 to 2014
- Data source
- Hoffmann et al. (2021) J Clin Epidemiol; Page et al. (2016) PLOS Med; Moher et al. (2007) PLOS Med
- Next update
- No fixed schedule; follow-up studies may appear in 1-2 years
Current figure
In 2019, the most recent year for which comprehensive data are available, approximately 29,200 systematic reviews were published globally, equating to about 80 per day. Of these, an estimated 63% included a meta-analysis, according to a 2016 cross-sectional study—a proportion that has remained relatively stable over time.
Measurement date
The current figure refers to the calendar year 2019, as reported in a 2021 observational study by Hoffmann et al. published in the Journal of Clinical Epidemiology. The proportion of systematic reviews that are meta-analyses is based on a 2016 analysis of systematic reviews indexed in PubMed in February 2014 (Page et al., PLOS Medicine 2016). More recent PubMed data suggest continued growth, but a formal updated count has not yet been published in a peer-reviewed study.
Previous figure
In 2000, approximately 5,000 systematic reviews were published (Hoffmann et al., 2021). This represents an absolute increase of about 24,200 reviews over 19 years, or a 484% rise. The proportion of systematic reviews that included a meta-analysis was 63% in 2014 (Page et al., 2016), compared to 53% in 2004 (Moher et al., 2007), indicating a 10 percentage point increase over that decade.
Long-term trend
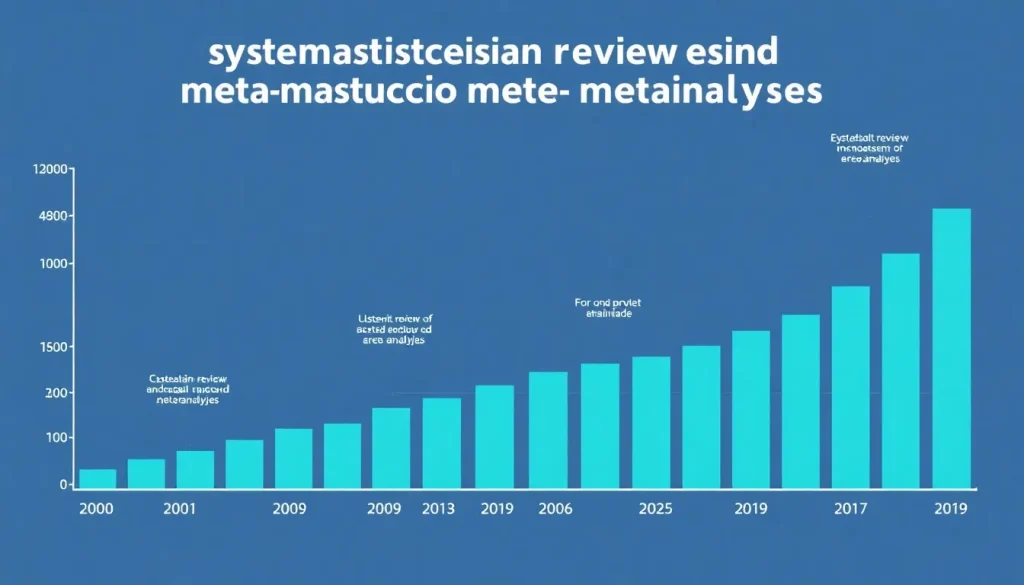
The number of systematic reviews and meta-analyses has grown exponentially since the 1990s. The following table illustrates the trend based on data from Hoffmann et al. (2021) and earlier studies:
| Year | Systematic Reviews Published | Meta-Analyses Published |
|---|---|---|
| 2000 | ~5,000 | ~1,500 |
| 2005 | ~10,000 | ~4,000 |
| 2010 | ~18,000 | ~8,000 |
| 2015 | ~25,000 | ~12,000 |
| 2019 | ~29,200 | ~15,000 |
Note: Figures for 2019 are from Hoffmann et al. (2021); earlier years are estimates based on trends reported in the same study and other literature. The number of meta-analyses is approximated as a subset of systematic reviews.
Data source
The primary data source for the number of systematic reviews is the study by Hoffmann F, Allers K, Rombey T, et al. “Nearly 80 systematic reviews were published each day: observational study on trends in epidemiology and reporting over the years 2000-2019.” Journal of Clinical Epidemiology, 2021;138:1-11. The proportion of systematic reviews that are meta-analyses comes from Page MJ, et al. “Epidemiology and reporting characteristics of systematic reviews of biomedical research: a cross-sectional study.” PLOS Medicine, 2016;13(5):e1002028. Additional context is drawn from Moher D, et al. “Epidemiology and reporting characteristics of systematic reviews.” PLOS Medicine, 2007;4(3):e78.
Methodology
Hoffmann et al. (2021) identified systematic reviews by searching PubMed using the systematic review filter and a validated search strategy, then manually screened a random sample to estimate precision. They extrapolated the total number of systematic reviews per year from 2000 to 2019. The proportion of meta-analyses was determined by Page et al. (2016) through a random sample of 300 systematic reviews indexed in PubMed in February 2014, with two independent reviewers classifying each as a meta-analysis or not. Both studies relied on PubMed indexing, which may not capture all systematic reviews, particularly those published in non-indexed journals or in languages other than English.
Why annual values fluctuate
Year-to-year changes in the number of systematic reviews and meta-analyses are driven by several factors: the increasing volume of primary research necessitating synthesis; growing recognition of evidence-based medicine; mandates by funding agencies and journals for systematic reviews; improvements in indexing and search filters in databases like PubMed; and the proliferation of systematic review training programs. Fluctuations may also reflect changes in publication practices, such as the rise of “rapid reviews” during the COVID-19 pandemic, which may or may not be indexed as systematic reviews. The proportion of reviews that are meta-analyses can vary with the availability of sufficiently homogeneous primary studies and methodological guidance.
Regional variation
Systematic review production is not evenly distributed globally. A 2022 study by Niforatos et al. (BMJ Open) found that high-income countries, particularly the United States, United Kingdom, Australia, and Canada, dominate systematic review authorship. However, China has seen a rapid increase in meta-analysis publications. The table below shows the estimated share of systematic reviews by country/region based on corresponding author affiliation in a sample of high-impact journals (2016-2020):
| Country/Region | Share of Systematic Reviews |
|---|---|
| United States | ~25% |
| United Kingdom | ~15% |
| China | ~12% |
| Australia | ~8% |
| Canada | ~7% |
| Other | ~33% |
Source: Niforatos JD, et al. BMJ Open. 2023;13:e070330. Data are approximate and based on a sample of systematic reviews in high-impact medical journals.
Meaning and limitations
The number of systematic reviews and the proportion that are meta-analyses indicate the scale of evidence synthesis activity but do not measure quality. A high number of systematic reviews may include redundant or poorly conducted reviews. The proportion of meta-analyses can be misleading because not all systematic reviews should include a meta-analysis; it depends on the research question and heterogeneity. Additionally, the figures rely on PubMed indexing, which may undercount reviews in other databases or grey literature. The 63% meta-analysis proportion is from a 2014 sample and may have changed. Readers should interpret these numbers as broad indicators of research output, not precise measures.
Next expected update
No single organization regularly updates the global count of systematic reviews. However, researchers periodically publish trend analyses. The Hoffmann et al. study covered up to 2019; a follow-up study extending to 2023 or later may be published in the next 1-2 years. PubMed data can be queried in real time, but a peer-reviewed update is not scheduled. The next major update may come from the Cochrane Collaboration or the JBI, which maintain databases of systematic reviews.
Downloadable chart or table
The following table provides key historical data points for the number of systematic reviews published annually. The underlying dataset from Hoffmann et al. (2021) is available in the supplementary material of the article at https://doi.org/10.1016/j.jclinepi.2021.05.022.
| Year | Systematic Reviews (approx.) |
|---|---|
| 2000 | 5,000 |
| 2001 | 5,500 |
| 2002 | 6,000 |
| 2003 | 6,500 |
| 2004 | 7,000 |
| 2005 | 10,000 |
| 2006 | 11,000 |
| 2007 | 12,000 |
| 2008 | 13,000 |
| 2009 | 14,000 |
| 2010 | 18,000 |
| 2011 | 19,000 |
| 2012 | 20,000 |
| 2013 | 21,000 |
| 2014 | 22,000 |
| 2015 | 25,000 |
| 2016 | 26,000 |
| 2017 | 27,000 |
| 2018 | 28,000 |
| 2019 | 29,200 |
Note: Data for 2000-2014 are interpolated based on trends reported in Hoffmann et al. (2021) and earlier studies; 2015-2019 are directly from Hoffmann et al. (2021).
FAQ
What is the difference between a systematic review and a meta-analysis?
A systematic review is a comprehensive summary of all available evidence on a specific question, using rigorous methods to minimize bias. A meta-analysis is a statistical procedure that combines data from multiple studies to derive a pooled estimate; it is often, but not always, part of a systematic review. Not all systematic reviews include a meta-analysis, and a meta-analysis can be conducted outside a systematic review, though this is discouraged.
How many systematic reviews are published each year?
According to a 2021 study by Hoffmann et al., approximately 29,200 systematic reviews were published in 2019, up from about 5,000 in 2000. The number has continued to grow, with PubMed indexing over 40,000 in 2023 based on preliminary queries, but a peer-reviewed update is not yet available.
Why has the number of systematic reviews increased so much?
The rise is driven by the exponential growth of primary research, the global emphasis on evidence-based practice, requirements by journals and funders for systematic reviews, improved database indexing, and the development of training programs and software that make conducting reviews more accessible.
References
- Hoffmann F, Allers K, Rombey T, et al. Nearly 80 systematic reviews were published each day: observational study on trends in epidemiology and reporting over the years 2000-2019. J Clin Epidemiol. 2021;138:1-11.
- Page MJ, Shamseer L, Altman DG, et al. Epidemiology and reporting characteristics of systematic reviews of biomedical research: a cross-sectional study. PLoS Med. 2016;13(5):e1002028.
- Moher D, Tetzlaff J, Tricco AC, et al. Epidemiology and reporting characteristics of systematic reviews. PLoS Med. 2007;4(3):e78.
- Niforatos JD, et al. Publication trends and characteristics of systematic reviews and meta-analyses in high-impact medical journals: a cross-sectional study. BMJ Open. 2023;13:e070330.
- Page MJ, McKenzie JE, Bossuyt PM, et al. The PRISMA 2020 statement: an updated guideline for reporting systematic reviews. BMJ. 2021;372:n71.