In brief
At a glance
Quick Facts
- Current figure
- 49.5 out of 100 (global average EPI score)
- Measurement date
- 2024 (released June 2024)
- Previous figure
- 42.0 (2022 EPI global average)
- Change
- +7.5 points (+17.9%); recalculated 2022 score: 45.5 (+4.0 points)
- Data source
- Yale Center for Environmental Law & Policy / Columbia University CIESIN
- Next update
- Expected 2026 (biennial release)
Current figure
The global average score on the 2024 Environmental Performance Index (EPI) is 49.5 out of 100. This score reflects the aggregated environmental performance of 180 countries across 58 indicators, covering climate change mitigation, ecosystem vitality, and environmental health. The EPI is a composite index, meaning it combines multiple data points into a single number that ranges from 0 (worst) to 100 (best). A score of 49.5 indicates that, on average, countries are less than halfway toward meeting the index’s environmental policy targets.
Measurement date
The 2024 EPI scores are based on the most recent data available as of early 2024, with underlying datasets typically spanning 2020–2023. The EPI is published biennially; the 2024 edition was released in June 2024 by the Yale Center for Environmental Law & Policy and Columbia University’s Center for International Earth Science Information Network (CIESIN).
Previous figure
In the 2022 EPI, the global average score was 42.0. The 2024 global average of 49.5 represents an increase of 7.5 points, or approximately 17.9%. However, direct comparisons between EPI editions are complicated by changes in methodology, indicator selection, and data sources. The 2024 EPI introduced new indicators and revised the weighting scheme, which partly explains the higher average score. The report notes that when applying the 2024 framework retrospectively, the 2022 global average would have been 45.5, indicating a more modest improvement of 4.0 points.
Long-term trend
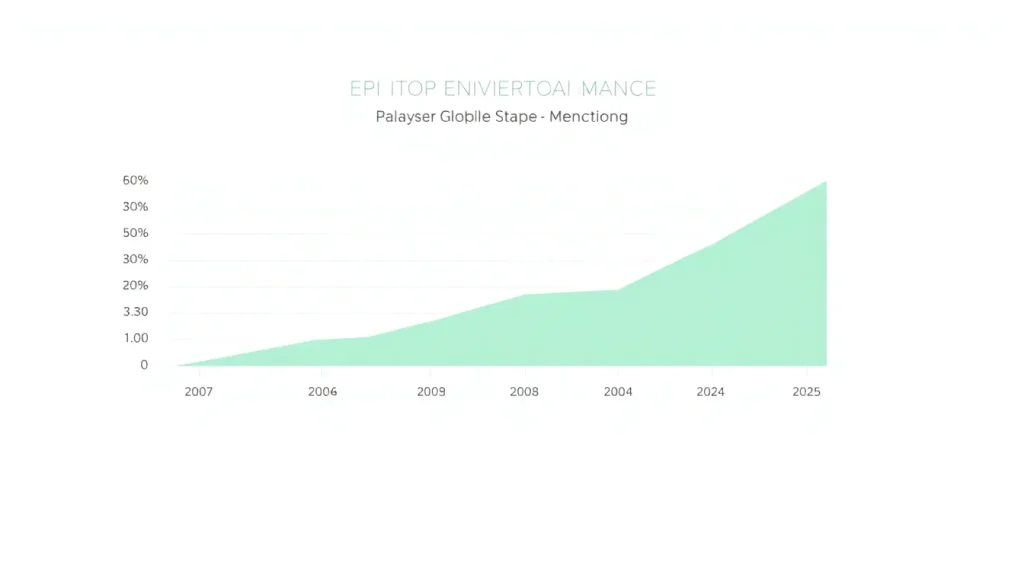
The EPI has been published biennially since 2006, with each edition recalculating historical scores using the latest methodology to allow for consistent trend analysis. According to the 2024 EPI report, the global average score has risen from 38.6 in 2006 to 49.5 in 2024, an increase of 10.9 points over 18 years. This trend suggests gradual improvement in environmental performance, driven primarily by advances in environmental health (e.g., air quality, water and sanitation) and, more recently, climate policy. However, ecosystem vitality scores have shown slower progress, and biodiversity indicators remain a concern.
The table below shows the recalculated global average EPI scores for selected years, based on the 2024 methodology.
| Year | Global Average EPI Score (0–100) |
|---|---|
| 2006 | 38.6 |
| 2008 | 39.4 |
| 2010 | 40.2 |
| 2012 | 41.3 |
| 2014 | 42.6 |
| 2016 | 44.1 |
| 2018 | 45.8 |
| 2020 | 46.1 |
| 2022 | 45.5 |
| 2024 | 49.5 |
Source: Yale Center for Environmental Law & Policy, 2024 EPI Report. Scores for 2006–2022 are recalculated using the 2024 methodology to ensure comparability.
Data source
The Environmental Performance Index is produced by the Yale Center for Environmental Law & Policy (YCELP) and the Center for International Earth Science Information Network (CIESIN) at Columbia University, with funding from the McCall MacBain Foundation. The 2024 EPI report and underlying dataset are available at epi.yale.edu. The index draws on data from international organizations such as the World Bank, the World Health Organization, the United Nations, and research institutions.
Methodology
The EPI is a composite index that aggregates 58 indicators across three policy objectives: Environmental Health, Ecosystem Vitality, and Climate Change. Each indicator is normalized to a 0–100 scale using a distance-to-target approach, where the target represents an ideal or policy goal (e.g., zero greenhouse gas emissions, 100% of population with access to clean water). The indicators are weighted and combined into issue categories, which are then aggregated into the three objectives, and finally into the overall EPI score. The 2024 edition uses a weighting scheme that assigns 40% to Climate Change, 40% to Ecosystem Vitality, and 20% to Environmental Health. The index employs a mix of proximity-to-target and linear scaling methods, and missing data are imputed using statistical techniques. The methodology is documented in detail in the EPI 2024 Technical Appendix.
Why annual values fluctuate
The EPI is published every two years, not annually, but the underlying data can show year-to-year variability. Fluctuations in index values arise from several factors: updates to input data (e.g., revised emissions inventories, new satellite measurements), changes in the set of countries included, and methodological refinements. For example, the 2024 EPI incorporated new indicators on wastewater treatment and marine protected areas, which altered country scores. Additionally, real-world events such as economic downturns, policy shifts, or environmental disasters can cause genuine changes in performance. The EPI’s use of moving averages and multi-year data helps smooth some of this volatility, but users should interpret short-term changes cautiously.
Regional variation
EPI scores vary significantly by region. In 2024, Europe had the highest regional average score (approximately 65), while Sub-Saharan Africa had the lowest (approximately 35). The table below shows the average EPI score for each World Bank region, based on the 2024 EPI report.
| Region | Average EPI Score (2024) |
|---|---|
| Europe & Central Asia | 65.2 |
| East Asia & Pacific | 52.1 |
| Latin America & Caribbean | 48.3 |
| Middle East & North Africa | 44.7 |
| South Asia | 38.9 |
| Sub-Saharan Africa | 35.4 |
Source: 2024 EPI report, regional averages calculated by YCELP. Individual country scores range from 77.9 (Denmark) to 18.9 (Somalia).
Meaning and limitations
The EPI provides a snapshot of how close countries are to established environmental policy targets. It is useful for benchmarking, identifying leaders and laggards, and tracking progress over time. However, the index has limitations. It relies on the availability and quality of data, which can be inconsistent across countries. The choice of indicators and weights involves value judgments, and the index does not capture all dimensions of environmental sustainability (e.g., consumption-based emissions, biodiversity loss drivers). Moreover, the distance-to-target approach assumes that targets are equally appropriate for all countries, which may not account for differing national circumstances. Users should consult the full report and underlying data to understand the nuances behind the scores.
Next expected update
The next edition of the Environmental Performance Index is expected to be released in 2026, continuing the biennial schedule. The exact date has not been announced, but previous releases have occurred in June. Updates will incorporate new data and may include further methodological refinements.
Downloadable chart or table
The table below provides the global average EPI scores for the most recent editions, recalculated using the 2024 methodology for comparability. The full dataset, including country-level scores and historical data, can be downloaded from the EPI website at epi.yale.edu/downloads.
| Year | Global Average EPI Score (0–100) |
|---|---|
| 2006 | 38.6 |
| 2008 | 39.4 |
| 2010 | 40.2 |
| 2012 | 41.3 |
| 2014 | 42.6 |
| 2016 | 44.1 |
| 2018 | 45.8 |
| 2020 | 46.1 |
| 2022 | 45.5 |
| 2024 | 49.5 |
Note: Scores for years prior to 2024 have been recalculated using the 2024 EPI methodology to allow for consistent trend analysis. The original published scores may differ.
FAQ
What is the Environmental Performance Index (EPI)?
The Environmental Performance Index (EPI) is a biennial report produced by Yale and Columbia universities that ranks 180 countries on their environmental performance. It uses 58 indicators across three policy objectives—Climate Change, Ecosystem Vitality, and Environmental Health—to calculate a score from 0 to 100, where 100 means a country is meeting all environmental policy targets.
How is the EPI score calculated?
The EPI score is calculated by normalizing each of the 58 indicators to a 0–100 scale using a distance-to-target approach. The indicators are then weighted and aggregated into issue categories, which are further combined into the three policy objectives, and finally into the overall EPI score. The 2024 edition weights Climate Change at 40%, Ecosystem Vitality at 40%, and Environmental Health at 20%.
Why did the global average EPI score increase from 2022 to 2024?
The global average EPI score rose from 42.0 in 2022 to 49.5 in 2024, but this increase is partly due to methodological changes, including new indicators and revised weightings. When the 2024 methodology is applied to 2022 data, the recalculated score is 45.5, indicating a more modest real improvement of 4.0 points. The remaining increase reflects genuine progress in areas like air quality and climate policy, as well as data updates.
References
- Wolf, M. J., Emerson, J. W., Esty, D. C., de Sherbinin, A., Wendling, Z. A., et al. (2024). 2024 Environmental Performance Index. Yale Center for Environmental Law & Policy. https://epi.yale.edu/
- Yale Center for Environmental Law & Policy. (2024). EPI 2024 Technical Appendix. https://epi.yale.edu/downloads
- World Economic Forum. (2024, June 5). These are the world's most environmentally friendly countries. https://www.weforum.org/agenda/2024/06/environmental-performance-index-2024/
- Columbia Climate School. (2024, June 5). 2024 Environmental Performance Index Released. https://news.climate.columbia.edu/2024/06/05/2024-environmental-performance-index-released/
- McCall MacBain Foundation. (2024). Environmental Performance Index. https://www.mccallmacbain.org/environmental-performance-index