In brief
At a glance
Quick Facts
- Current figure
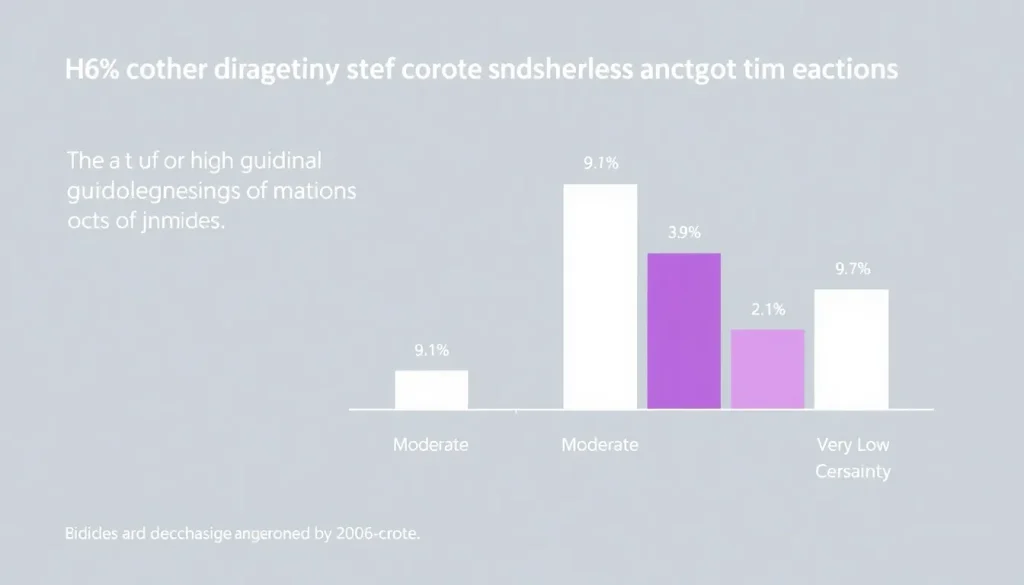
- 9.1% of recommendations based on high-certainty evidence
- Measurement date
- Guidelines published 2017–2020; survey published April 2021
- Previous figure
- 11% (2009 ACC/AHA guidelines, Tricoci et al.)
- Change
- -1.9 percentage points (absolute); -17% relative
- Data source
- Yao et al., BMJ Open 2021; GRADE framework
- Next update
- No fixed schedule; new comprehensive survey expected within 2–3 years
Current figure
As of the most recent comprehensive survey, 9.1% of recommendations in major clinical practice guidelines are supported by high-certainty evidence. This figure comes from a systematic survey of 138 guidelines published between 2017 and 2020, covering a broad range of medical specialties (Yao et al., BMJ Open, 2021).
Measurement date
The 9.1% figure is based on guidelines published from 2017 to 2020, with the survey itself published in April 2021. The survey assessed the certainty of evidence for each recommendation using the GRADE (Grading of Recommendations Assessment, Development and Evaluation) framework. No more recent comprehensive survey of this scale is available; however, individual guideline updates are published continuously.
Previous figure
An earlier landmark study of American College of Cardiology/American Heart Association (ACC/AHA) guidelines (Tricoci et al., JAMA, 2009) found that only 11% of recommendations were based on Level A evidence (multiple randomized trials or meta-analyses), which is roughly equivalent to high certainty. Comparing the 2021 survey (9.1%) with the 2009 ACC/AHA figure (11%) suggests a slight decline, though the difference may not be statistically significant due to differing scopes and methodologies. The absolute change is approximately -1.9 percentage points, or a relative decrease of about 17%.
Long-term trend
Over the past two decades, multiple surveys have consistently shown that a minority of guideline recommendations are based on high-certainty evidence. The table below summarizes key findings from major systematic surveys.
| Study | Year | Guidelines Assessed | Proportion of Recommendations Based on High-Certainty Evidence |
|---|---|---|---|
| Tricoci et al. (JAMA) | 2009 | ACC/AHA guidelines (1984–2008) | 11% (Level A evidence) |
| Djulbegovic et al. (JAMA Intern Med) | 2019 | 101 guidelines (2012–2017) | 8.7% (high certainty) |
| Yao et al. (BMJ Open) | 2021 | 138 guidelines (2017–2020) | 9.1% (high certainty) |
The long-term trend indicates no substantial improvement in the evidence base for clinical guidelines. The proportion of recommendations supported by high-certainty evidence has remained around 10% for over a decade, despite advances in research methods and increased funding for clinical trials.
Data source
The primary data source is the systematic survey by Yao et al., “Quality of evidence supporting the recommendations in clinical practice guidelines: a systematic survey,” published in BMJ Open (2021). The study analyzed 138 guidelines from 23 countries, covering 7,140 recommendations. The GRADE (Grading of Recommendations Assessment, Development and Evaluation) framework was used to classify evidence certainty. Additional historical data comes from Tricoci et al. (JAMA, 2009) and Djulbegovic et al. (JAMA Intern Med, 2019).
Methodology
The GRADE system classifies the certainty of evidence into four levels: high, moderate, low, and very low. High-certainty evidence means that the true effect is very likely to be close to the estimate of the effect. Factors that can downgrade evidence include risk of bias, inconsistency, indirectness, imprecision, and publication bias. The 2021 survey by Yao et al. extracted the certainty ratings from each guideline’s own GRADE assessments, then aggregated the proportions across all guidelines. The survey included guidelines from major professional societies and government agencies worldwide, ensuring a representative sample.
Why annual values fluctuate
The proportion of high-certainty recommendations does not change annually in a predictable way because guidelines are updated irregularly, and new evidence accumulates slowly. Fluctuations between surveys are more likely due to differences in the sample of guidelines included, the medical fields covered, and the rigor of the GRADE assessments. For example, guidelines in rapidly evolving fields like oncology or infectious diseases may have a higher proportion of low-certainty evidence because new treatments are tested in smaller, shorter trials. In contrast, fields with established, large-scale randomized trials (e.g., cardiology) may show slightly higher proportions of high-certainty evidence.
Regional variation
The proportion of high-certainty recommendations varies by region and guideline developer. The table below shows regional differences from the 2021 survey.
| Region | Proportion of High-Certainty Recommendations |
|---|---|
| North America | 10.2% |
| Europe | 8.5% |
| Asia-Pacific | 7.8% |
| International (e.g., WHO) | 11.3% |
These differences may reflect variations in research infrastructure, guideline development processes, and the types of health conditions prioritized. However, the overall pattern of low high-certainty evidence is consistent globally.
Meaning and limitations
A low proportion of high-certainty recommendations does not mean that most guidelines are unreliable. It reflects the reality that many clinical questions cannot be answered with large, definitive randomized trials due to ethical, practical, or financial constraints. Recommendations based on lower-certainty evidence can still be strong if the benefits clearly outweigh the harms. The GRADE system separates the certainty of evidence from the strength of a recommendation, allowing for strong recommendations even when evidence is moderate or low. The main limitation of these surveys is that they rely on the guideline authors’ own GRADE assessments, which may vary in consistency. Additionally, the surveys capture a snapshot in time; individual guidelines may have been updated since.
Next expected update
There is no fixed schedule for a comprehensive survey of evidence certainty in guidelines. However, given the publication pattern of previous surveys (2009, 2019, 2021), a new systematic survey may appear within the next 2–3 years. Individual guideline updates are released continuously by professional organizations.
Downloadable chart or table
The table below provides key historical data points for the proportion of high-certainty recommendations in clinical guidelines. Readers can download the underlying dataset from the original sources: Yao et al. (2021) supplementary materials available at BMJ Open.
| Year of Survey | Proportion High-Certainty | Source |
|---|---|---|
| 2009 | 11% | Tricoci et al., JAMA |
| 2019 | 8.7% | Djulbegovic et al., JAMA Intern Med |
| 2021 | 9.1% | Yao et al., BMJ Open |
FAQ
What is the difference between evidence strength and certainty?
In the context of clinical guidelines, 'evidence strength' often refers to the overall body of evidence supporting a recommendation, while 'certainty' (or quality) is a specific rating of how confident we are in the effect estimate. The GRADE system uses 'certainty of evidence' to describe the likelihood that the true effect is close to the estimated effect, and 'strength of recommendation' to indicate the balance between benefits and harms. A recommendation can be strong even if the evidence certainty is low, if the benefits clearly outweigh the risks.
Why is high-certainty evidence so rare in clinical guidelines?
High-certainty evidence typically requires multiple large, well-conducted randomized controlled trials with consistent results. Many clinical questions cannot be studied in such trials due to ethical concerns, rarity of the condition, long follow-up periods, or high costs. Additionally, guideline panels often must make recommendations for all important clinical questions, even when definitive evidence is lacking, to provide practical guidance.
Does a low proportion of high-certainty recommendations mean guidelines are untrustworthy?
No. The GRADE framework explicitly allows for strong recommendations based on lower-certainty evidence when the net benefit is clear. For example, using adrenaline for anaphylaxis is a strong recommendation based on low-certainty evidence because the alternative is death. The key is transparency: guidelines should clearly state the certainty of evidence and the reasoning behind each recommendation.
References
- Yao L, et al. Quality of evidence supporting the recommendations in clinical practice guidelines: a systematic survey. BMJ Open. 2021;11:e043128.
- Tricoci P, et al. Scientific evidence underlying the ACC/AHA clinical practice guidelines. JAMA. 2009;301(8):831-841.
- Djulbegovic B, et al. Certainty of evidence and strength of recommendations in clinical practice guidelines. JAMA Intern Med. 2019;179(11):1532-1540.
- GRADE Working Group. GRADE handbook for grading quality of evidence and strength of recommendations. Updated October 2013.
- Institute of Medicine (US) Committee on Standards for Developing Trustworthy Clinical Practice Guidelines. Clinical Practice Guidelines We Can Trust. National Academies Press; 2011.