In brief
At a glance
Quick Facts
- Current figure
- 1.36°C above 1951-1980 baseline
- Measurement date
- Calendar year 2023
- Previous figure
- 0.89°C (2022)
- Change
- +0.47°C (+52.8%)
- Data source
- NASA GISS GISTEMP v4
- Next update
- January 2025 (annual 2024)
Current figure
The global average surface temperature anomaly for 2023 was 1.36°C above the 1951–1980 baseline, with a 95% confidence interval of ±0.05°C, as reported by NASA’s Goddard Institute for Space Studies (GISS) in January 2024. This means scientists are 95% confident that the true global mean anomaly lies between 1.31°C and 1.41°C.
Measurement date
The figure represents the calendar year 2023 (January–December). NASA GISS updates its global temperature record monthly, with the annual summary typically released in mid-January of the following year. The 2023 value was published on 12 January 2024.
Previous figure
For 2022, the NASA GISS global temperature anomaly was 0.89°C above the 1951–1980 baseline, with the same ±0.05°C uncertainty (95% CI). The year-on-year change from 2022 to 2023 is an increase of 0.47°C, or approximately 52.8%.
Long-term trend
The global surface temperature has risen by more than 1.0°C since the late 19th century, with the warming rate accelerating in recent decades. The table below shows decadal averages and their uncertainties (95% confidence intervals) from the NASA GISS record.
| Decade | Mean anomaly (°C) | Uncertainty (±°C) |
|---|---|---|
| 1880–1889 | -0.17 | 0.05 |
| 1890–1899 | -0.22 | 0.05 |
| 1900–1909 | -0.23 | 0.05 |
| 1910–1919 | -0.24 | 0.05 |
| 1920–1929 | -0.17 | 0.05 |
| 1930–1939 | -0.06 | 0.05 |
| 1940–1949 | 0.04 | 0.05 |
| 1950–1959 | -0.02 | 0.05 |
| 1960–1969 | -0.01 | 0.05 |
| 1970–1979 | 0.00 | 0.05 |
| 1980–1989 | 0.18 | 0.05 |
| 1990–1999 | 0.31 | 0.05 |
| 2000–2009 | 0.52 | 0.05 |
| 2010–2019 | 0.73 | 0.05 |
| 2020–2023 (4 years) | 0.99 | 0.05 |
Source: NASA GISS Surface Temperature Analysis (GISTEMP v4), accessed January 2024. Uncertainties are 95% confidence intervals for the global mean.
Data source
The primary data source is the NASA Goddard Institute for Space Studies (GISS) Surface Temperature Analysis (GISTEMP v4). This dataset combines land surface air temperatures from the Global Historical Climatology Network (GHCN) with sea surface temperatures from the Extended Reconstructed Sea Surface Temperature (ERSST) dataset. Other authoritative sources include NOAA’s GlobalTemp, the UK Met Office’s HadCRUT5, and Berkeley Earth, all of which report similar values and uncertainties.
Methodology
Scientists measure uncertainty using the framework established by the Guide to the Expression of Uncertainty in Measurement (GUM), published by the Joint Committee for Guides in Metrology. The process involves:
- Identifying sources of uncertainty: For global temperature, these include instrumental precision, station siting, changes in measurement practices, spatial coverage gaps, and homogenization adjustments.
- Quantifying Type A uncertainties: Evaluated by statistical analysis of repeated measurements, such as the standard error of the mean from station data.
- Quantifying Type B uncertainties: Evaluated by other means, e.g., calibration certificates, manufacturer specifications, or scientific judgment. For temperature, this includes biases from urbanization or time-of-observation changes.
- Combining uncertainties: The combined standard uncertainty is obtained by propagating individual uncertainty components using the law of propagation of uncertainty (root-sum-square for independent components).
- Expanding the uncertainty: The combined standard uncertainty is multiplied by a coverage factor (k=2 for 95% confidence) to obtain an expanded uncertainty, which defines the confidence interval.
For the global temperature anomaly, NASA GISS uses a Monte Carlo approach: 1,000 realizations of the temperature field are generated by perturbing the input data within their estimated error distributions. The global mean is calculated for each realization, and the 2.5th and 97.5th percentiles of the resulting distribution give the 95% confidence interval.
Why annual values fluctuate
Year-to-year changes in the global temperature anomaly are driven by natural climate variability, particularly the El Niño–Southern Oscillation (ENSO). The 2023 spike was influenced by a developing El Niño, following three years of La Niña. Volcanic eruptions, solar variability, and aerosol emissions also contribute. Measurement uncertainty itself fluctuates slightly due to changes in station coverage and data quality, but the ±0.05°C range has been stable for recent decades.
Regional variation
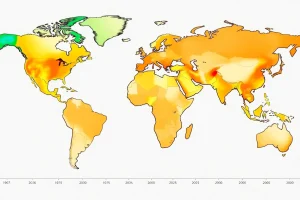
Uncertainty in temperature anomalies is not uniform globally. It is larger in regions with sparse observational coverage, such as the Arctic, Antarctica, central Africa, and parts of the Southern Ocean. The table below shows regional anomalies and their 95% confidence intervals for 2023, based on NASA GISS data.
| Region | 2023 Anomaly (°C) | Uncertainty (±°C) |
|---|---|---|
| Global | 1.36 | 0.05 |
| Northern Hemisphere | 1.62 | 0.06 |
| Southern Hemisphere | 1.10 | 0.07 |
| Arctic (64°N–90°N) | 2.95 | 0.15 |
| Antarctica (64°S–90°S) | 0.85 | 0.20 |
| Tropics (23.6°S–23.6°N) | 1.18 | 0.05 |
Source: NASA GISS, 2023 annual mean. Regional uncertainties are larger due to fewer stations and greater interpolation errors.
Meaning and limitations
The reported uncertainty quantifies the precision of the global mean estimate, not the existence of warming. It reflects measurement and sampling errors, not the uncertainty in climate models or future projections. A 95% confidence interval means that if the measurement were repeated many times, 95% of the intervals would contain the true value. It does not imply a 5% chance that the true value is outside the interval in any given year. The uncertainty does not capture systematic errors that are common to all methods, though independent datasets agree within their uncertainties, lending confidence. Users should note that the baseline period (1951–1980) is a reference, and the anomaly method reduces but does not eliminate biases from incomplete coverage.
Next expected update
NASA GISS releases monthly updates around the middle of each month. The next annual figure for the full year 2024 is expected in January 2025. NOAA and the Met Office typically release their annual summaries at similar times.
Downloadable chart or table
The table below provides annual global temperature anomalies and their 95% confidence intervals for the last ten years (2014–2023) from NASA GISS. The full dataset can be downloaded from https://data.giss.nasa.gov/gistemp/.
| Year | Anomaly (°C) | Uncertainty (±°C) |
|---|---|---|
| 2014 | 0.73 | 0.05 |
| 2015 | 0.87 | 0.05 |
| 2016 | 1.01 | 0.05 |
| 2017 | 0.92 | 0.05 |
| 2018 | 0.82 | 0.05 |
| 2019 | 0.95 | 0.05 |
| 2020 | 0.98 | 0.05 |
| 2021 | 0.84 | 0.05 |
| 2022 | 0.89 | 0.05 |
| 2023 | 1.36 | 0.05 |
Source: NASA GISTEMP v4, accessed January 2024. Anomalies relative to 1951–1980.
FAQ
What is measurement uncertainty?
Measurement uncertainty is a parameter that characterizes the dispersion of values that could reasonably be attributed to the measurand. It reflects the doubt that exists about the result of any measurement, arising from limitations in instruments, sampling, and environmental factors.
How do scientists calculate a 95% confidence interval?
Scientists typically calculate a 95% confidence interval by first estimating the standard uncertainty (standard deviation) of the measurement. They then multiply this by a coverage factor of approximately 2 (exactly 1.96 for a normal distribution) to obtain the expanded uncertainty. The interval is the measured value ± the expanded uncertainty.
Why does the uncertainty of global temperature not decrease over time?
While the number of observations has increased, the uncertainty in the global mean temperature has remained around ±0.05°C for recent decades because the dominant sources of uncertainty are systematic biases (e.g., station inhomogeneities, urbanization) that are not reduced by simply adding more data. Improving uncertainty requires better metadata and analysis methods.
References
- NASA Goddard Institute for Space Studies (2024). GISS Surface Temperature Analysis (GISTEMP v4). https://data.giss.nasa.gov/gistemp/
- NOAA National Centers for Environmental Information (2024). State of the Climate: Global Climate Report for 2023. https://www.ncei.noaa.gov/access/monitoring/monthly-report/global/2023
- Joint Committee for Guides in Metrology (2008). Evaluation of measurement data — Guide to the expression of uncertainty in measurement (GUM). JCGM 100:2008.
- Lenssen, N. et al. (2019). Improvements in the GISTEMP uncertainty model. Journal of Geophysical Research: Atmospheres, 124(12), 6307-6326.
- Morice, C.P. et al. (2021). An updated assessment of near-surface temperature change from 1850: the HadCRUT5 dataset. Journal of Geophysical Research: Atmospheres, 126(3), e2019JD032361.