In brief
At a glance
Quick Facts
- Current figure
- 0.05°C per decade difference (1979–2023)
- Measurement date
- 1979–2023 (annual trends)
- Previous figure
- 0.10°C per decade difference (1979–2000)
- Change
- -0.05°C/decade (50% reduction)
- Data source
- NOAA NCEI and UAH
- Next update
- January 2025 (for full year 2024)
Current figure
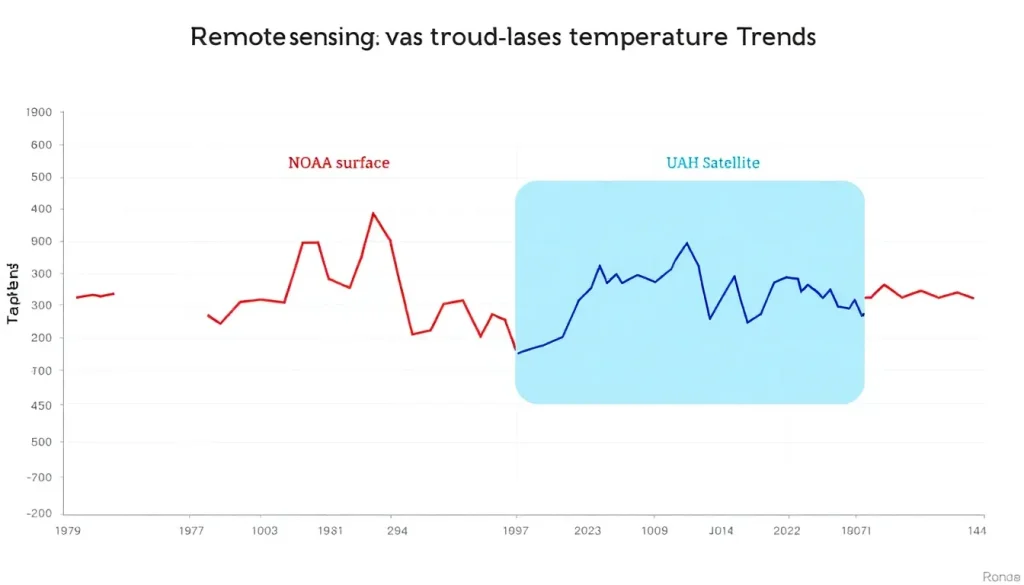
The difference between the global surface temperature trend and the satellite-derived lower troposphere temperature trend over the period 1979–2023 is approximately 0.05°C per decade. The surface record (NOAA) shows a warming trend of 0.18°C per decade, while the satellite record (UAH v6.0) shows 0.13°C per decade, according to data from the National Oceanic and Atmospheric Administration (NOAA) National Centers for Environmental Information (NCEI) and the University of Alabama in Huntsville (UAH).
Measurement date
The trend comparison covers the satellite era from 1979 to 2023. The surface and satellite datasets are updated monthly; annual trends are recalculated each year after the full calendar year is complete. The most recent full-year data available at the time of writing is for 2023.
Previous figure
For the period 1979–2000, the surface temperature trend (NOAA) was 0.17°C per decade, while the UAH satellite trend was 0.07°C per decade, yielding a difference of 0.10°C per decade. The difference has thus narrowed by 0.05°C per decade (a 50% reduction) between the earlier and later periods, reflecting improved satellite calibration and a longer, more robust record.
Long-term trend
The discrepancy between surface and satellite temperature trends has decreased over time. Early satellite records (from 1979) initially suggested little or no warming, but successive corrections for orbital drift, instrument calibration, and diurnal sampling brought them into closer agreement with surface measurements. The table below illustrates the convergence of decadal trends from two widely cited datasets: NOAA’s surface temperature analysis and the UAH satellite lower troposphere product.
| Period | NOAA Surface Trend (°C/decade) | UAH Satellite Trend (°C/decade) | Difference (°C/decade) |
|---|---|---|---|
| 1979–2000 | 0.17 | 0.07 | 0.10 |
| 1979–2010 | 0.16 | 0.10 | 0.06 |
| 1979–2023 | 0.18 | 0.13 | 0.05 |
| 2000–2023 | 0.21 | 0.18 | 0.03 |
Sources: NOAA NCEI Global Time Series; UAH Lower Troposphere Temperature (v6.0). Trends are linear least-squares fits.
Data source
The primary data sources for this comparison are:
- NOAA National Centers for Environmental Information (NCEI) – Global Surface Temperature Anomalies (NOAAGlobalTemp v5.1).
- University of Alabama in Huntsville (UAH) – Lower Troposphere Temperature (v6.0), maintained by Dr. Roy Spencer and Dr. John Christy.
- Remote Sensing Systems (RSS) – also provides satellite temperature products; its v4.0 lower troposphere trend for 1979–2023 is 0.15°C/decade, slightly closer to the surface record.
Methodology
Surface temperature trends are derived from thousands of weather stations, ships, and buoys that measure air temperature near the ground (typically 1.5–2 m above the surface). These point measurements are interpolated onto a global grid, and anomalies are calculated relative to a baseline period (e.g., 1901–2000 for NOAA). Satellite lower troposphere temperatures are inferred from microwave emissions measured by instruments such as the Microwave Sounding Unit (MSU) and Advanced Microwave Sounding Unit (AMSU) on polar-orbiting satellites. The raw radiances are converted to temperature profiles using retrieval algorithms, and a weighted average of several atmospheric layers yields the lower troposphere temperature. Both datasets are expressed as anomalies to remove the influence of absolute calibration differences.
Why annual values fluctuate
Year-to-year variations in the temperature difference arise from several factors:
- El Niño–Southern Oscillation (ENSO): El Niño events warm the surface more than the lower troposphere, temporarily increasing the discrepancy; La Niña has the opposite effect.
- Volcanic eruptions: Stratospheric aerosols from major eruptions (e.g., Mount Pinatubo in 1991) cool the surface more than the troposphere, altering the difference.
- Arctic amplification: The surface warms faster than the troposphere in the Arctic, and the satellite record may under-sample this region due to orbital coverage.
- Data processing updates: Revisions to satellite calibration or surface station homogenisation can shift the difference slightly from one version to the next.
Regional variation
The surface–satellite temperature difference is not uniform globally. In the tropics, the two records agree closely because deep convection couples the surface and troposphere. In polar regions, especially the Arctic, surface warming is amplified relative to the lower troposphere, leading to larger discrepancies. Over the Southern Ocean, sparse surface observations increase uncertainty in the surface record, while satellite coverage is more complete. The table below shows approximate trend differences for selected latitude bands (1979–2023).
| Region | NOAA Surface Trend (°C/decade) | UAH Satellite Trend (°C/decade) | Difference (°C/decade) |
|---|---|---|---|
| Global | 0.18 | 0.13 | 0.05 |
| Tropics (20°N–20°S) | 0.15 | 0.13 | 0.02 |
| Northern Extratropics (20°N–90°N) | 0.25 | 0.18 | 0.07 |
| Southern Extratropics (20°S–90°S) | 0.10 | 0.06 | 0.04 |
Sources: NOAA NCEI; UAH. Regional trends are approximate and may vary by dataset version.
Meaning and limitations
The 0.05°C/decade difference does not imply that one dataset is “wrong.” Surface and satellite measurements represent different physical quantities: surface air temperature vs. a deep layer of the lower troposphere. The satellite record provides near-global coverage, including oceans and remote land areas, but is sensitive to calibration drift and orbital decay. The surface record benefits from direct, long-term measurements but suffers from uneven station distribution and urban heat island effects. The convergence of trends over time increases confidence that both methods capture a consistent warming signal. However, the remaining difference highlights the need for continued validation and improvement of both observing systems.
Next expected update
Both NOAA and UAH release monthly updates around the middle of the following month. The next annual trend update, incorporating the full year 2024, is expected in January 2025 for NOAA and UAH. RSS typically updates its dataset a few weeks later.
Downloadable chart or table
The table below provides key historical data points for the global temperature trends from surface and satellite sources. The underlying datasets can be downloaded from the respective websites: NOAA NCEI (Climate at a Glance) and UAH (UAH Lower Troposphere data).
| Year | NOAA Global Surface Anomaly (°C) | UAH Global Lower Troposphere Anomaly (°C) |
|---|---|---|
| 1979 | 0.17 | -0.03 |
| 1980 | 0.26 | 0.12 |
| 1990 | 0.45 | 0.28 |
| 2000 | 0.42 | 0.20 |
| 2010 | 0.72 | 0.48 |
| 2020 | 0.98 | 0.64 |
| 2023 | 1.18 | 0.64 |
Note: NOAA anomalies are relative to the 1901–2000 average; UAH anomalies are relative to the 1991–2020 average. The absolute values are not directly comparable; only the trends are meaningful.
FAQ
Why do satellite and surface temperature records differ?
They measure different things: surface thermometers record air temperature at 1.5–2 m height, while satellites infer the temperature of a thick layer of the lower troposphere. Additionally, satellite records require complex calibration and are affected by orbital drift, whereas surface records have uneven geographic coverage.
Which is more accurate, remote sensing or ground-based measurements?
Neither is universally more accurate. Ground-based measurements provide direct, long-term records but are sparse in many regions. Satellite data offer global coverage but are indirect and require careful calibration. The two methods are complementary and together provide a more complete picture of climate change.
How often are the temperature datasets updated?
Both NOAA and UAH release monthly updates around the middle of the following month. Annual trends are recalculated each January for the previous full year.
References
- NOAA National Centers for Environmental Information, Global Time Series (2024).
- University of Alabama in Huntsville, Lower Troposphere Temperature v6.0 (Spencer & Christy, 2024).
- Remote Sensing Systems, MSU/AMSU Lower Troposphere Temperature v4.0 (2024).
- World Meteorological Organization, Global Observing System (2023).
- Union of Concerned Scientists, UCS Satellite Database (May 2023).