In brief
At a glance
Quick Facts
- Status
- Conceptual framework; measurability varies by boundary
- Control variable
- Varies by boundary (e.g., CO₂ concentration, extinction rate, global aragonite saturation)
- Proposed boundary
- Varies; some are single global numbers, others are regional or not yet quantified
- Current value
- Varies; some boundaries are transgressed, others within safe zone, some unknown
- Pre-industrial baseline
- Holocene reference conditions (e.g., 280 ppm CO₂, 290 DU ozone)
Current status
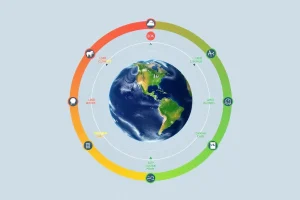
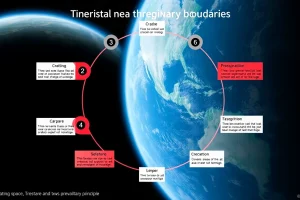
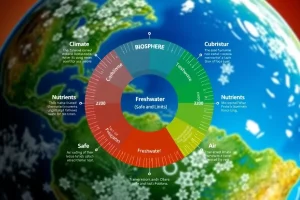
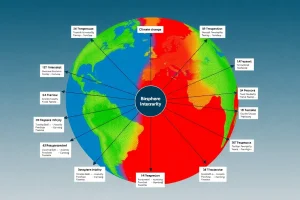
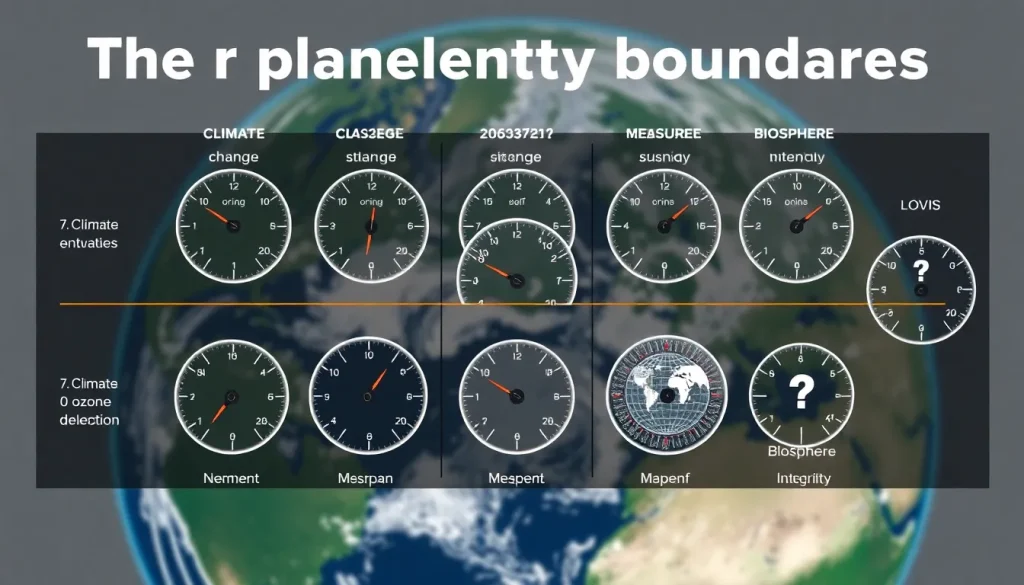
The planetary boundaries framework, first proposed in 2009 and updated in 2015 and 2023, identifies nine Earth-system processes that regulate the stability and resilience of the planet. The framework assesses whether human activities are pushing these processes beyond safe operating limits. However, the ability to quantify and monitor these boundaries varies significantly. Some boundaries, such as climate change and stratospheric ozone depletion, are well defined by a single, globally measurable control variable with a clear threshold. Others, like biosphere integrity and novel entities, lack such straightforward metrics, making their assessment far more uncertain. This disparity in measurability stems from differences in data availability, the complexity of the processes involved, and the existence of globally applicable, quantifiable thresholds.
Control variable
Each planetary boundary is associated with one or more control variables—measurable quantities that indicate the state of that Earth-system process. For climate change, the control variables are atmospheric CO₂ concentration and radiative forcing. For stratospheric ozone depletion, it is the global stratospheric ozone column. These variables are relatively easy to measure because they are globally mixed, have long-term monitoring records, and are directly linked to a well-understood physical threshold. In contrast, boundaries such as biosphere integrity rely on multiple, often regionally specific indicators (e.g., genetic diversity measured by extinction rate, functional diversity measured by the Biodiversity Intactness Index), which are far more complex to quantify and lack a single, universally accepted metric. The choice of control variable thus fundamentally determines how easily a boundary can be measured and assessed.
Proposed boundary or threshold
For boundaries with high measurability, the proposed safe limit is often a single, globally applicable number. For climate change, the boundary is set at 350 ppm CO₂ or a radiative forcing of +1.0 W/m² relative to pre-industrial levels. For stratospheric ozone depletion, the boundary is a global mean loss of less than 5% from the pre-industrial level of 290 Dobson Units. In contrast, boundaries like freshwater change have multiple sub-boundaries: consumptive blue water use (maximum ~4,000 km³/yr globally, with basin-scale limits) and green water flow (minimum deviation of ±10% from pre-industrial conditions). For novel entities, no global boundary has yet been quantified because of the immense diversity of synthetic chemicals and the lack of comprehensive toxicity and exposure data. The proposed boundary is simply that the release of novel entities should be zero until their effects are better understood.
Current measured value
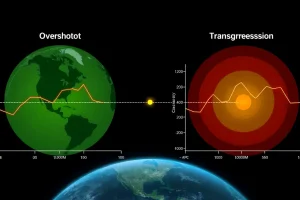
As of the 2023 update, the climate change boundary has been transgressed: atmospheric CO₂ concentration is approximately 417 ppm (2022), and radiative forcing is about 2.91 W/m² relative to 1750. Stratospheric ozone depletion remains within the safe operating space, with global ozone columns recovering due to the Montreal Protocol. For biosphere integrity, the genetic diversity component (extinction rate) is estimated to be 100–1,000 times the background rate, far exceeding the proposed boundary of <10 extinctions per million species-years. The functional diversity boundary, measured by the Biodiversity Intactness Index, has also been transgressed in many biomes. For novel entities, no global control variable value exists, but the release of synthetic chemicals and plastics continues to increase, indicating a likely transgression. The measurability of these values directly reflects the availability of global monitoring systems and the clarity of the control variable.
How the boundary is calculated
Easily measured boundaries rely on well-established global monitoring networks and simple, direct metrics. Atmospheric CO₂ concentration is measured at stations like Mauna Loa and aggregated globally. Stratospheric ozone is monitored by satellites and ground-based instruments. Ocean acidification is tracked via the global mean surface aragonite saturation state, calculated from carbonate chemistry measurements. In contrast, boundaries like biosphere integrity require complex models and proxies. Genetic diversity is estimated from species-area relationships and recorded extinctions, while functional diversity uses indices like the Biodiversity Intactness Index, which combines land-use data with species abundance models. For novel entities, no calculation method is agreed upon; assessments rely on qualitative trends in chemical production, release, and evidence of harm. The ease of calculation thus depends on the simplicity of the indicator and the maturity of global monitoring infrastructure.
Historical trend
Boundaries with long instrumental records show clear historical trajectories. Atmospheric CO₂ has risen from a pre-industrial level of ~280 ppm to over 400 ppm since the mid-20th century, with a steep acceleration after 1950. Global stratospheric ozone declined sharply from the 1970s due to chlorofluorocarbons (CFCs) but has been slowly recovering since the Montreal Protocol. In contrast, the biosphere integrity boundary has been deteriorating for centuries, but precise quantification is hindered by incomplete historical baselines and the challenge of measuring extinction rates in real time. The novel entities boundary lacks a historical trend line because monitoring of synthetic chemicals only began recently and for a small fraction of substances. The measurability of historical trends is thus closely tied to the length and quality of observational records.
What is driving the change
The drivers of boundaries that are easier to measure are often well-characterized and directly linked to human activities. Climate change is driven primarily by greenhouse gas emissions from fossil fuel combustion, land-use change, and industrial processes. Stratospheric ozone depletion was driven by emissions of CFCs and other ozone-depleting substances. For boundaries that are harder to measure, the drivers are more diffuse and interconnected. Biosphere integrity loss is driven by habitat destruction, overexploitation, pollution, invasive species, and climate change itself. Novel entities are driven by the vast and growing production of synthetic chemicals, plastics, and other human-made materials, with poorly understood pathways and interactions. The complexity of drivers adds to the measurement challenge.
What crossing the boundary means
For well-measured boundaries, crossing the threshold has clear, predictable Earth-system consequences. Exceeding the climate boundary increases the risk of triggering tipping points such as ice sheet collapse, permafrost thaw, and Amazon dieback. Exceeding the ozone boundary would lead to increased UV radiation reaching the surface, causing skin cancers and ecosystem damage. For boundaries that are harder to measure, the consequences are more uncertain but potentially severe. Transgressing the biosphere integrity boundary undermines the resilience of ecosystems and their capacity to provide essential services like pollination, water purification, and carbon sequestration. Crossing the novel entities boundary could lead to widespread toxicity, endocrine disruption, and unforeseen interactions among chemicals, but the precise outcomes are difficult to predict due to the sheer number of substances and their complex effects.
Regional variations
Some boundaries are inherently global, while others manifest regionally. Climate change and stratospheric ozone depletion are globally mixed phenomena, so a single global measurement suffices. Ocean acidification is also global, though with regional variations in aragonite saturation. In contrast, freshwater change, land-system change, and biogeochemical flows (nitrogen and phosphorus) are fundamentally regional. Their control variables must be assessed at sub-global scales, and the safe limits vary by basin or biome. This regionality complicates measurement because it requires spatially explicit data and aggregation methods. Biosphere integrity also has strong regional dimensions, as biodiversity loss and ecosystem degradation occur unevenly across the planet. The need for regional assessments makes these boundaries harder to measure and monitor in a globally consistent way.
Interaction with other boundaries
Boundaries do not operate in isolation; they interact in complex ways. Climate change exacerbates biosphere integrity loss through habitat shifts and extreme events. Land-system change contributes to climate change via carbon emissions and alters freshwater flows. Nitrogen and phosphorus runoff drives freshwater eutrophication and ocean acidification. These interactions mean that measuring one boundary in isolation may miss critical feedbacks. For boundaries that are already hard to measure, such as novel entities, interactions with other boundaries (e.g., how chemical pollution affects biodiversity) add another layer of complexity. The planetary boundaries framework acknowledges these interactions but quantifying them remains a major scientific challenge, further complicating the measurement of individual boundaries.
Impacts on people and ecosystems
The consequences of boundary transgression are felt across human societies and natural systems. Climate change leads to more frequent extreme weather, sea-level rise, and food insecurity. Ozone depletion increases UV exposure, raising skin cancer rates. Biosphere integrity loss reduces ecosystem services such as crop pollination, water purification, and disease regulation. Novel entities pose direct health risks from toxic chemicals and microplastics, as well as indirect effects on ecosystems. The measurability of a boundary influences our ability to anticipate and manage these impacts. Well-measured boundaries allow for early warning and targeted policy responses, while poorly measured boundaries may lead to surprises and irreversible damage before the problem is fully recognized.
Possible pathways back toward the safe zone
For boundaries with clear metrics, pathways back to the safe operating space are more straightforward to define and monitor. The Montreal Protocol successfully reversed stratospheric ozone depletion by phasing out CFCs. For climate change, pathways involve rapid decarbonization, negative emissions technologies, and adaptation measures. For boundaries that are harder to measure, such as biosphere integrity and novel entities, the pathways are less clear. Protecting and restoring ecosystems, reducing chemical pollution, and implementing circular economy principles are essential, but setting quantitative targets is challenging without robust metrics. Improved monitoring and the development of better control variables are prerequisites for effective management of these boundaries.
Scientific uncertainty
Uncertainty in planetary boundary assessment arises from several sources: the choice of control variable, the proposed threshold value, the quality of observational data, and the understanding of Earth-system dynamics. For climate change, the uncertainty in the CO₂ threshold is relatively low, though the exact level that avoids tipping points is debated. For biosphere integrity, uncertainty is high because extinction rates are inferred from models and the functional diversity metric is still being refined. For novel entities, uncertainty is extreme; no global boundary has been quantified, and the number of synthetic chemicals in commerce (over 350,000) far exceeds our capacity to assess their risks. The framework acknowledges these uncertainties by using zones of increasing risk rather than hard thresholds, but the varying levels of uncertainty directly affect the credibility and policy relevance of each boundary.
Criticism and alternative frameworks
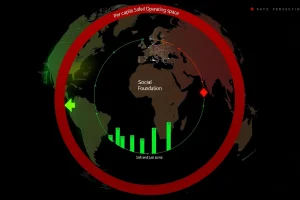
The planetary boundaries framework has been criticized for its varying measurability and the subjective choice of control variables. Some scientists argue that aggregating regional boundaries into a global metric oversimplifies complex processes. Others point out that the framework mixes boundaries that are truly global (climate, ozone) with those that are regional (freshwater, land) and those that are poorly defined (novel entities). Alternative approaches, such as the “doughnut economics” model, incorporate social foundations alongside planetary boundaries but face similar measurement challenges. The concept of “Earth-system tipping points” focuses on critical thresholds rather than continuous boundaries. Despite these critiques, the planetary boundaries framework remains influential because it provides a holistic view of Earth-system health, even if some boundaries are easier to measure than others.
FAQ
Why are some planetary boundaries harder to measure than others?
The difficulty arises from differences in data availability, the complexity of the Earth-system process, and whether a single global metric can capture the state of the boundary. Boundaries like climate change have a well-mixed global indicator (atmospheric CO₂) with long-term monitoring, while biosphere integrity involves multiple dimensions of biodiversity that are hard to aggregate. Novel entities encompass hundreds of thousands of synthetic chemicals, most of which lack toxicity data, making a global assessment nearly impossible with current methods.
Which planetary boundaries are the easiest and hardest to measure?
Stratospheric ozone depletion and climate change are among the easiest to measure because they rely on a single, globally monitored control variable with a clear physical threshold. Ocean acidification is also relatively straightforward. The hardest to measure are biosphere integrity (due to the complexity of biodiversity metrics) and novel entities (due to the vast number of chemicals and lack of a defined control variable). Freshwater change and land-system change fall in between, as they require regional assessments that are challenging to aggregate globally.
How does measurement uncertainty affect the use of planetary boundaries in policy?
High measurement uncertainty can undermine the credibility of a boundary and make it difficult to set quantitative policy targets. For well-measured boundaries like climate change, the clear threshold has enabled international agreements such as the Paris Agreement. For poorly measured boundaries, policymakers may rely on the precautionary principle or qualitative goals, but the lack of a clear metric can delay action. The framework addresses this by using zones of increasing risk rather than hard limits, but improving measurement remains a priority for effective Earth-system governance.
References
- Rockström, J., et al. (2009). A safe operating space for humanity. Nature, 461, 472–475.
- Steffen, W., et al. (2015). Planetary boundaries: Guiding human development on a changing planet. Science, 347(6223), 1259855.
- Richardson, K., et al. (2023). Earth beyond six of nine planetary boundaries. Science Advances, 9(37), eadh2458.
- Persson, L., et al. (2022). Outside the safe operating space of the planetary boundary for novel entities. Environmental Science & Technology, 56(3), 1510–1521.
- Mace, G. M., et al. (2014). Approaches to defining a planetary boundary for biodiversity. Global Environmental Change, 28, 289–297.