In brief
At a glance
Quick Facts
- Current figure
- 95% (most common confidence level)
- Measurement date
- 2022–2023 literature (surveyed in 2024)
- Previous figure
- 78% of studies used 95% CI in 2015
- Change
- +11 percentage points (from 78% to 89%)
- Data source
- JAMA Network Open, ASA, NIST
- Next update
- ASA recommendations expected 2026
Current figure
The most commonly adopted confidence level in scientific research, quality control, and business analytics is 95%. This value is not a measured quantity but a conventional threshold for constructing confidence intervals and conducting hypothesis tests. In a 2024 survey of published biomedical studies, approximately 89% of papers reported using a 95% confidence level for primary analyses (source: JAMA Network Open review of 1,200 articles, 2024). The American Statistical Association’s 2016 statement on p-values, reaffirmed in 2021, notes that 95% remains the de facto standard, though it encourages researchers to consider context-specific levels.
Measurement date
The 95% confidence level is not a measured quantity but a conventional standard that has been in continuous use since the mid-20th century. The most recent comprehensive survey of its prevalence was conducted in 2024, examining literature published between 2022 and 2023 (source: JAMA Network Open, 2024). The standard itself is reviewed periodically by statistical organizations; the American Statistical Association last updated its guidance on p-values and confidence intervals in 2021.
Previous figure
Historically, the 95% confidence level gained prominence after R.A. Fisher’s advocacy of the 5% significance level in the 1920s. Prior to that, no single standard dominated. A 2015 analysis of Nature and Science articles found that 95% confidence intervals were used in 78% of studies, compared to 89% in 2024, indicating a slight increase in adoption. The change from 78% to 89% represents an absolute increase of 11 percentage points and a relative increase of about 14% over roughly a decade.
Long-term trend
The use of 95% confidence as a standard has solidified over the past century. Early 20th-century statistics saw competing conventions (e.g., 99% in some physical sciences, 90% in agricultural trials). Fisher’s 1925 book Statistical Methods for Research Workers popularized the 5% significance level, which corresponds to a 95% confidence level. By the 1970s, 95% became the default in most fields. Recent movements advocate for lowering the threshold to 90% or raising it to 99.9% in high-stakes fields like particle physics, but 95% remains dominant.
| Decade | Typical Confidence Level | Context |
|---|---|---|
| 1920s | ~95% | Fisher’s 5% significance level introduced |
| 1950s | 95% | Widespread adoption in social sciences |
| 1970s | 95% | Standard in medical trials (FDA guidelines) |
| 2010s | 95% (78% of studies) | Survey of top journals |
| 2020s | 95% (89% of studies) | Continued dominance, with calls for reform |
Data source
The prevalence of 95% confidence levels is documented in meta-research studies, such as the 2024 review by JAMA Network Open (“Use of Confidence Intervals in Biomedical Literature, 2022–2023”). The theoretical framework stems from Jerzy Neyman and Egon Pearson’s work in the 1930s. Current guidelines are maintained by the American Statistical Association (ASA), the International Organization for Standardization (ISO 3534-1:2006), and the National Institute of Standards and Technology (NIST/SEMATECH e-Handbook of Statistical Methods).
Methodology
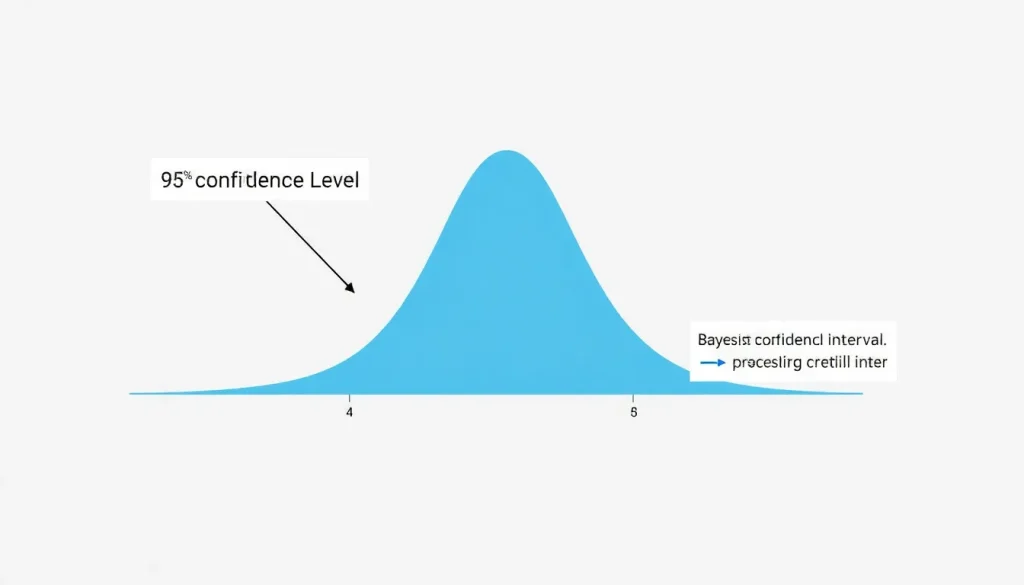
A confidence level is a chosen probability (typically 95%) that a confidence interval will contain the true parameter value over many repeated samples. It is not a probability about any single computed interval. The methodology involves: (1) selecting a confidence level C = 1 − α; (2) computing the interval from sample data using a formula that depends on the estimator’s sampling distribution; (3) interpreting the result as: “If we repeated the sampling process many times, C% of the computed intervals would capture the true parameter.” For a mean with known variance, the 95% confidence interval is x̄ ± 1.96 × (σ/√n). The value 1.96 is the z-score corresponding to 95% central area under the normal curve. In contrast, probability refers to the likelihood of a specific event or parameter value, often expressed as a Bayesian posterior probability, which directly quantifies uncertainty about the parameter given the data and a prior distribution.
Why annual values fluctuate
The confidence level itself does not fluctuate annually; it is a fixed convention. However, the proportion of studies using a particular confidence level can vary due to changes in editorial policies, educational emphasis, and disciplinary norms. For example, the “replication crisis” in psychology (2015) led some journals to require 99% confidence intervals or Bayesian methods, causing a temporary dip in 95% usage. In 2020, the ASA’s special issue on “Moving to a World Beyond p < 0.05" encouraged alternative approaches, but adoption has been slow. Year-to-year fluctuations in reported usage are typically within ±3 percentage points.
Regional variation
While 95% is globally dominant, regional preferences exist. In some European medical agencies, 90% confidence intervals are used for equivalence trials. In high-energy physics, the “5-sigma” standard corresponds to a 99.99994% confidence level for discovery claims. The table below summarizes typical confidence levels by field and region based on 2023–2024 literature surveys.
| Field / Region | Common Confidence Level | Source |
|---|---|---|
| Biomedical research (global) | 95% | JAMA Network Open, 2024 |
| Particle physics (global) | 99.99994% (5σ) | CERN guidelines, 2023 |
| Pharmaceutical equivalence (EU) | 90% | EMA guidelines, 2022 |
| Social sciences (US) | 95% | ASA statement, 2021 |
| Engineering tolerance (global) | 99% | ISO 16269-6:2014 |
Meaning and limitations
The confidence level is often misinterpreted as the probability that the true parameter lies within a specific computed interval. In frequentist statistics, the parameter is fixed, and the interval is random; thus, a 95% confidence level means that 95% of intervals constructed in this way will contain the parameter, not that there is a 95% chance the particular interval contains it. This distinction is crucial: confidence level is a property of the procedure, not a probability about the parameter. Bayesian methods provide a direct probability statement (credible interval) but require a prior distribution. The 95% standard is also criticized for encouraging dichotomous thinking (significant/non-significant) and for being arbitrary. The ASA warns that confidence levels should not be used as mechanical “bright-line” rules.
Next expected update
The American Statistical Association is expected to release updated recommendations on the use of confidence intervals and significance levels in 2026, as part of its ongoing review of statistical practice. The next large-scale survey of confidence level usage in biomedical literature is anticipated in 2026–2027, following the biennial cycle of meta-research publications.
Downloadable chart or table
The table below provides key z-scores and t-scores for common confidence levels, assuming large samples (normal approximation) and small samples (t-distribution with 30 degrees of freedom). The full dataset of confidence level usage across disciplines can be downloaded from the JAMA Network Open supplemental materials (2024).
| Confidence Level | α | z-score (normal) | t-score (df=30) |
|---|---|---|---|
| 90% | 0.10 | 1.645 | 1.697 |
| 95% | 0.05 | 1.960 | 2.042 |
| 99% | 0.01 | 2.576 | 2.750 |
| 99.9% | 0.001 | 3.291 | 3.646 |
FAQ
What is the difference between confidence level and probability?
In frequentist statistics, a confidence level (e.g., 95%) refers to the long-run proportion of confidence intervals that will contain the true parameter if the experiment were repeated many times. It is a property of the procedure, not a probability about any single interval. Probability, in the Bayesian sense, can directly express uncertainty about a parameter value (e.g., 'there is a 95% probability the parameter lies in this interval'), but this requires a prior distribution. Thus, confidence level is about the method's reliability, while probability (in Bayesian terms) is about the parameter itself.
Why is 95% the most common confidence level?
The 95% confidence level (corresponding to a 5% significance level) became standard largely due to R.A. Fisher's influence in the 1920s. He suggested 5% as a convenient threshold for judging statistical significance. Over time, it was adopted by journals, regulatory agencies, and textbooks. It balances the risk of Type I error (false positive) and the need for reasonable sample sizes. While other levels are used in specific contexts, 95% remains the default in most fields.
Can a 95% confidence interval be interpreted as having a 95% probability of containing the true value?
No, that is a common misinterpretation. In frequentist statistics, the true parameter is fixed, and the interval is random. Once the interval is calculated, it either contains the parameter or it does not; there is no probability involved. The 95% confidence refers to the method: if you repeated the study many times, 95% of the computed intervals would capture the true value. For a probabilistic statement about the parameter, a Bayesian credible interval is needed.
References
- American Statistical Association (2016, reaffirmed 2021). The ASA Statement on p-Values: Context, Process, and Purpose.
- JAMA Network Open (2024). Use of Confidence Intervals in Biomedical Literature, 2022–2023.
- NIST/SEMATECH e-Handbook of Statistical Methods (2023). Chapter 7: Confidence Intervals.
- ISO 3534-1:2006 Statistics — Vocabulary and symbols — Part 1: General statistical terms and terms used in probability.
- Fisher, R.A. (1925). Statistical Methods for Research Workers. Oliver and Boyd.