In brief
At a glance
Quick Facts
- Current figure
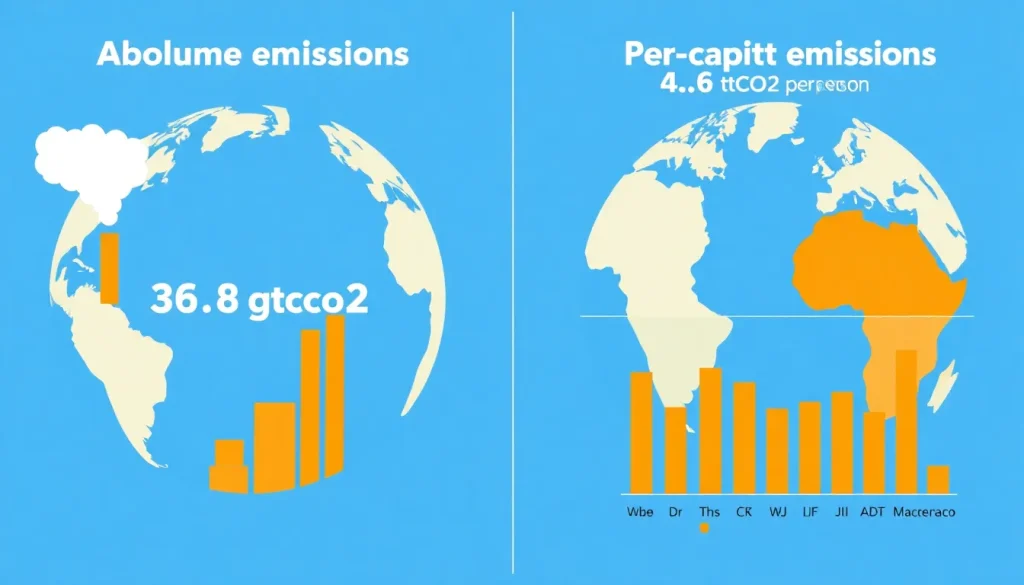
- 36.8 GtCO2 (absolute), 4.6 tCO2 per person (per-capita)
- Measurement date
- 2023 (preliminary)
- Previous figure
- 36.4 GtCO2, 4.7 tCO2 per person (2022)
- Change
- +0.4 GtCO2 (+1.1%) absolute; -0.1 tCO2 (-2.1%) per-capita
- Data source
- Global Carbon Project (Global Carbon Budget 2023)
- Next update
- November/December 2024
Current figure
As of 2023, global absolute carbon dioxide (CO2) emissions from fossil fuels and industry are projected to reach 36.8 billion tonnes (GtCO2), according to the Global Carbon Project. The corresponding global average per-capita CO2 emissions are estimated at 4.6 tonnes per person for the same year.
Measurement date
These figures refer to the full calendar year 2023 and are based on preliminary projections published in December 2023. The Global Carbon Budget is updated annually, with final figures typically released in the following year.
Previous figure
In 2022, global absolute CO2 emissions were 36.4 GtCO2, and per-capita emissions were 4.7 tonnes per person. The absolute increase of 0.4 GtCO2 represents a 1.1% rise, while per-capita emissions declined by 0.1 tonnes (‑2.1%) due to population growth.
Long-term trend
Global absolute CO2 emissions have risen dramatically since the mid-20th century, from about 6 GtCO2 in 1950 to over 36 GtCO2 today. Per-capita emissions peaked earlier in many developed countries but continue to rise globally, though at a slower rate. The table below shows decadal averages.
| Year | Global CO2 emissions (GtCO2) | Global per-capita CO2 (t/person) |
|---|---|---|
| 1960 | 9.4 | 3.1 |
| 1970 | 14.9 | 4.0 |
| 1980 | 19.5 | 4.4 |
| 1990 | 22.7 | 4.3 |
| 2000 | 25.6 | 4.2 |
| 2010 | 33.3 | 4.8 |
| 2020 | 34.8 | 4.4 |
| 2023 | 36.8 | 4.6 |
Source: Global Carbon Budget 2023; Our World in Data.
Data source
The primary source for global CO2 emissions data is the Global Carbon Project (GCP), which publishes the annual Global Carbon Budget. The data are also accessible via Our World in Data, which compiles long-term series from GCP and other sources. National emissions inventories are submitted to the UNFCCC.
Methodology
Absolute emissions are estimated based on fossil fuel consumption, flaring, and cement production data, combined with emission factors. Per-capita emissions are calculated by dividing total national emissions by the population. The GCP integrates multiple data streams, including energy statistics from the IEA and UN, and uses atmospheric CO2 measurements to validate trends.
Why annual values fluctuate
Year-to-year changes in absolute emissions are driven by economic growth, energy demand, fuel mix, weather (affecting heating/cooling), and one-off events like the COVID-19 pandemic. Per-capita emissions additionally fluctuate with population growth. For example, a country may increase total emissions but if population grows faster, per-capita emissions can decline.
Regional variation
There are stark differences between countries. High-income nations often have high per-capita emissions but may have declining absolute emissions. Emerging economies may have lower per-capita emissions but rising totals. The table below shows 2022 data for selected countries (source: Global Carbon Project via Our World in Data).
| Country | Absolute emissions (MtCO2, 2022) | Per-capita emissions (tCO2, 2022) |
|---|---|---|
| China | 11,397 | 8.0 |
| United States | 5,057 | 15.2 |
| India | 2,830 | 2.0 |
| Russia | 1,652 | 11.4 |
| Japan | 1,083 | 8.6 |
| Germany | 673 | 8.1 |
| Qatar | 119 | 35.6 |
| World | 36,400 | 4.7 |
Note: 2022 data are the latest full-year national estimates. 2023 projections are not yet available at the country level.
Meaning and limitations
Absolute emissions indicate a country’s total contribution to climate change and are crucial for global carbon budgets. Per-capita emissions highlight inequality in resource use and are often used in equity discussions. However, per-capita figures can obscure the impact of large, populous countries with low per-capita emissions but high absolute totals. Neither metric accounts for historical emissions, consumption-based emissions (carbon footprint), or non-CO2 greenhouse gases. Both metrics are necessary for a complete picture.
Next expected update
The Global Carbon Budget 2024 is expected to be released in November or December 2024, providing preliminary estimates for 2024 and final data for 2023. The IEA also publishes annual CO2 emissions data, typically in March.
Downloadable chart or table
The table below provides historical global CO2 emissions and per-capita values from 1960 to 2023. The full dataset can be downloaded from the Global Carbon Budget website (globalcarbonbudget.org) or Our World in Data.
| Year | Absolute emissions (GtCO2) | Per-capita emissions (tCO2) |
|---|---|---|
| 1960 | 9.4 | 3.1 |
| 1970 | 14.9 | 4.0 |
| 1980 | 19.5 | 4.4 |
| 1990 | 22.7 | 4.3 |
| 2000 | 25.6 | 4.2 |
| 2010 | 33.3 | 4.8 |
| 2015 | 35.4 | 4.8 |
| 2019 | 36.7 | 4.7 |
| 2020 | 34.8 | 4.4 |
| 2021 | 36.3 | 4.6 |
| 2022 | 36.4 | 4.7 |
| 2023 | 36.8 (proj.) | 4.6 (proj.) |
Source: Global Carbon Budget 2023; Our World in Data.
FAQ
Why compare absolute and per-capita emissions?
Comparing absolute and per-capita emissions provides a more complete picture of a country's climate impact. Absolute emissions show the total contribution to global warming, which is critical for meeting global carbon budgets. Per-capita emissions reveal inequalities in resource consumption and are often used in discussions about fairness and responsibility, as they account for population size. For example, a country with high absolute emissions but a large population may have a low per-capita figure, while a small, wealthy nation may have low absolute emissions but very high per-capita emissions.
Which metric is more important for climate policy?
Both metrics are essential but serve different purposes. Absolute emissions are crucial for setting and tracking national emission reduction targets under the Paris Agreement, as the atmosphere responds to the total amount of greenhouse gases. Per-capita emissions are important for equity considerations, such as determining fair shares of the remaining carbon budget and assessing lifestyle impacts. Effective climate policy often integrates both, using absolute targets for mitigation and per-capita metrics to guide sustainable development and consumption patterns.
How do per-capita emissions vary across countries?
Per-capita emissions vary widely. In 2022, Qatar had the highest per-capita CO2 emissions at 35.6 tonnes per person, while many low-income countries in Africa emitted less than 1 tonne per person. Major emitters like the United States (15.2 tCO2) and China (8.0 tCO2) are above the global average of 4.7 tCO2, while India (2.0 tCO2) is below. These differences reflect disparities in energy use, industrialization, and consumption patterns.
References
- Global Carbon Project. (2023). Global Carbon Budget 2023. https://globalcarbonbudget.org/
- Our World in Data. CO2 emissions. https://ourworldindata.org/co2-emissions
- International Energy Agency. (2024). CO2 Emissions in 2023. https://www.iea.org/reports/co2-emissions-in-2023
- UNFCCC. National Inventory Submissions. https://unfccc.int/ghg-inventories-annex-i-parties/2023
- IPCC. (2022). Climate Change 2022: Mitigation of Climate Change. Working Group III contribution to the Sixth Assessment Report.