In brief
At a glance
Quick Facts
- GDP Definition
- Total market value of all final goods and services produced within a country in a given period.
- GPI Definition
- A metric that adjusts personal consumption for income inequality, environmental costs, and social factors to measure sustainable well-being.
- Key Difference
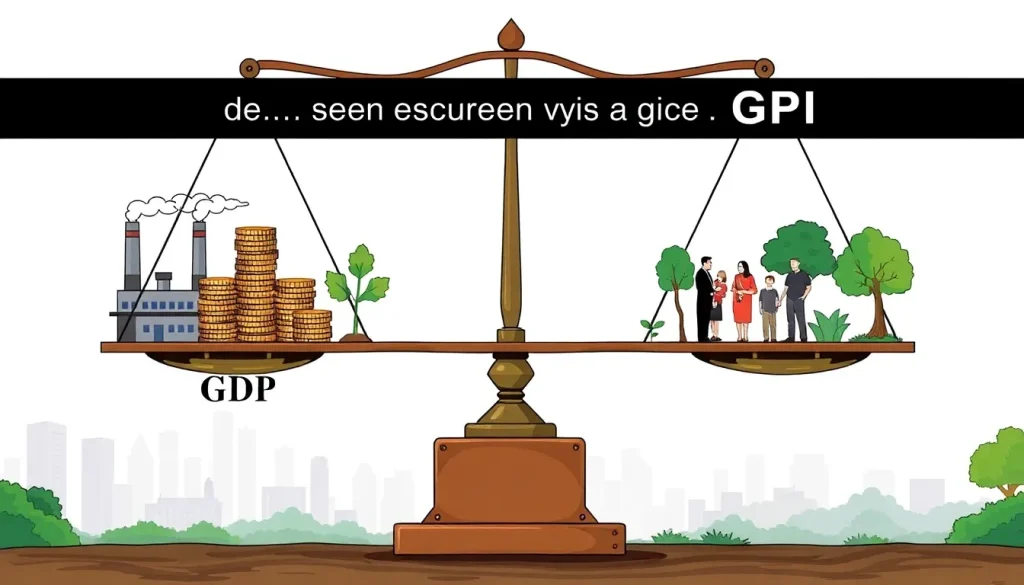
- GDP counts all spending as positive; GPI subtracts costs of pollution, crime, and inequality while adding benefits of unpaid work.
- Origin of GDP
- Developed in the 1930s by Simon Kuznets for the U.S. Congress.
- Origin of GPI
- Created in the 1990s by Redefining Progress, building on the Index of Sustainable Economic Welfare (ISEW).
- Typical Trend
- In many developed nations, GDP per capita has risen while GPI per capita has stagnated or declined since the 1970s.
- Components of GPI
- Includes over 20 adjustments such as value of household work, cost of pollution, resource depletion, and loss of leisure time.
- Primary Use
- GDP is used for macroeconomic policy; GPI is used to assess sustainable development and guide long-term policy.
Key Takeaways
- Gross Domestic Product (GDP) measures the total market value of goods and services produced, while the Genuine Progress Indicator (GPI) adjusts for factors like income inequality, environmental degradation, and the value of unpaid work.
- GPI provides a more comprehensive measure of economic well-being by accounting for social and environmental costs and benefits that GDP ignores.
- While GDP has risen steadily in many countries, GPI often shows stagnation or decline, indicating that economic growth does not necessarily improve quality of life.
- Understanding the differences between GDP and GPI is essential for policymakers aiming to promote sustainable and equitable development.
What Is GDP vs Genuine Progress Indicator?
Gross Domestic Product (GDP) and the Genuine Progress Indicator (GPI) are both metrics used to assess economic performance, but they differ fundamentally in what they measure and how they define progress. GDP is the total monetary value of all finished goods and services produced within a country’s borders in a specific time period. It is the most widely used indicator of economic activity and is often interpreted as a measure of a nation’s overall prosperity. In contrast, the Genuine Progress Indicator is an alternative metric that adjusts GDP by accounting for social, environmental, and economic factors that GDP overlooks, such as income distribution, pollution, and the value of household and volunteer work.
While GDP simply adds up all market transactions regardless of their impact on well-being, GPI starts with personal consumption expenditures and then applies a series of adjustments. It subtracts costs associated with crime, pollution, resource depletion, and loss of leisure time, while adding benefits from unpaid work, public infrastructure, and volunteerism. The result is a more nuanced measure that reflects whether economic activity is actually improving people’s lives and sustaining the environment. This distinction matters because a rising GDP can mask growing inequality or environmental damage, whereas GPI aims to reveal the true net contribution of economic activity to societal welfare.
Overview
GDP and GPI serve different purposes in economic analysis. GDP is a production-based metric that counts all market transactions as positive contributions, regardless of their nature. For example, spending on cleaning up an oil spill or treating a disease adds to GDP, even though these activities reflect harm rather than progress. GPI, on the other hand, is a welfare-based metric that distinguishes between beneficial and harmful economic activities. It incorporates over 20 different adjustments to personal consumption, including the value of unpaid work, the cost of crime, pollution, and resource depletion, and the impact of income inequality. This makes GPI a more holistic measure of sustainable economic well-being.
Both indicators are typically expressed in monetary terms and can be compared over time to assess trends. While GDP is calculated by national statistical agencies using standardized methods, GPI is often computed by independent researchers or non-governmental organizations due to its complexity and the need for diverse data sources. Despite its limitations, GDP remains the dominant metric for economic policy, but GPI and similar alternative indicators are gaining traction as tools for guiding more balanced and sustainable development.
History
GDP was developed in the 1930s by economist Simon Kuznets for the U.S. Congress to measure the nation’s economic output during the Great Depression. It was later refined and adopted internationally as the standard measure of economic activity after the Bretton Woods Conference in 1944. Kuznets himself warned that GDP should not be equated with well-being, as it excludes many factors that affect quality of life. Despite this caution, GDP became the primary gauge of economic success for nations worldwide.
The Genuine Progress Indicator emerged in the 1990s as a response to growing criticism of GDP’s inadequacy as a welfare measure. It was developed by the non-profit organization Redefining Progress, building on earlier work such as the Index of Sustainable Economic Welfare (ISEW) proposed by Herman Daly and John Cobb in 1989. The GPI refined the ISEW framework and has since been calculated for numerous countries and regions, including the United States, Australia, and several European nations. Its development reflects a broader movement toward sustainable development indicators that account for environmental and social dimensions of progress.
How It Works
GDP is typically calculated using the expenditure approach: GDP = Consumption + Investment + Government Spending + (Exports – Imports). This method sums all final purchases of goods and services, treating every dollar spent as a positive contribution to the economy. It does not distinguish between productive and destructive activities, nor does it account for the depletion of natural resources or the distribution of income.
GPI, in contrast, begins with personal consumption expenditures and then applies a series of adjustments. These adjustments are grouped into three categories: economic, environmental, and social. Economic adjustments include accounting for income inequality (using the Gini coefficient), adding the value of unpaid household and volunteer work, and subtracting costs associated with commuting, crime, and underemployment. Environmental adjustments subtract the costs of pollution, resource depletion, and long-term environmental damage, while adding the value of net capital investment and net foreign borrowing. Social adjustments account for the costs of family breakdown, loss of leisure time, and the value of public infrastructure. The final GPI figure represents a net welfare measure that can be compared to GDP to assess whether economic growth is translating into genuine progress.
What the Evidence Shows
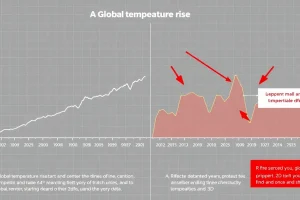
Studies comparing GDP and GPI over time reveal a striking divergence. In the United States, for example, GDP per capita has risen steadily since the 1950s, but GPI per capita peaked around 1970 and has remained relatively flat or declined slightly since then. Similar patterns have been observed in other developed countries, including the United Kingdom, Australia, and several European nations. This suggests that while economic activity has increased, the net benefits to society have not kept pace, largely due to rising environmental costs and income inequality.
At the global level, GPI calculations indicate that the gap between GDP and GPI has widened over time. This divergence is driven by factors such as climate change, resource depletion, and the growing social costs of economic growth. These findings support the argument that GDP alone is an insufficient guide for policy, as it can signal prosperity even when well-being is declining. The evidence from GPI studies has been used to advocate for policies that prioritize sustainable development, such as investments in renewable energy, social safety nets, and environmental protection.
Benefits, Limitations and Trade-offs
GDP’s primary benefits are its simplicity, widespread availability, and comparability across countries and time periods. It provides a clear, standardized snapshot of economic activity that is useful for fiscal and monetary policy. However, its limitations are significant: it ignores non-market activities, environmental degradation, income distribution, and overall well-being. This can lead to policy decisions that promote growth at the expense of social and environmental health.
GPI offers a more comprehensive view of progress by incorporating these missing dimensions. Its benefits include highlighting the hidden costs of economic growth and providing a metric aligned with sustainable development goals. However, GPI also has limitations. It requires extensive data and involves subjective decisions about which factors to include and how to value them. Methodologies can vary between studies, making cross-country comparisons difficult. Additionally, GPI is not as timely or frequently updated as GDP, limiting its use for short-term policy. The trade-off is between the simplicity and immediacy of GDP and the depth and accuracy of GPI. Many experts argue that using both indicators together can provide a more balanced understanding of economic performance.
Common Misconceptions
One common misconception is that GDP measures a country’s overall well-being or happiness. In reality, GDP only measures market transactions and does not account for health, education, environmental quality, or leisure time. Another misconception is that GPI is a perfect substitute for GDP. While GPI addresses many of GDP’s shortcomings, it is not without its own challenges, including data limitations and methodological debates. Some also believe that a rising GDP always indicates a healthy economy, but this ignores the possibility of unsustainable growth that depletes natural capital or increases inequality. Finally, there is a misconception that GPI is purely an academic concept with no practical use; in fact, several U.S. states and countries have adopted GPI or similar indicators to inform policy decisions.
FAQ
What is the difference between GDP and the Genuine Progress Indicator?
GDP measures the total market value of goods and services produced, while GPI adjusts for factors like income inequality, environmental damage, and unpaid work to reflect true economic well-being.
How is the Genuine Progress Indicator calculated?
GPI starts with personal consumption expenditures, then adds benefits (e.g., unpaid work, public infrastructure) and subtracts costs (e.g., pollution, crime, resource depletion) using a standardized set of adjustments.
Why does the Genuine Progress Indicator matter?
GPI matters because it reveals whether economic growth is actually improving quality of life and sustainability, helping policymakers avoid decisions that boost GDP at the expense of long-term well-being.
References
- Bureau of Economic Analysis, U.S. Department of Commerce. "Gross Domestic Product."
- Talberth, J., Cobb, C., & Slattery, N. (2007). "The Genuine Progress Indicator 2006: A Tool for Sustainable Development." Redefining Progress.
- Kubiszewski, I., Costanza, R., Franco, C., Lawn, P., Talberth, J., Jackson, T., & Aylmer, C. (2013). "Beyond GDP: Measuring and achieving global genuine progress." Ecological Economics, 93, 57-68.