In brief
At a glance
Quick Facts
- Current figure
- Five SSPs (SSP1–SSP5) as defined in 2017
- Measurement date
- SSP Database version 2.0 (2018)
- Previous figure
- SRES scenarios (A1, A2, B1, B2) from 2000
- Change
- Shift from combined socio-emission storylines to a matrix framework with separate climate policy dimensions
- Data source
- IIASA SSP Database; Riahi et al. (2017); O’Neill et al. (2017)
- Next update
- No scheduled update; likely to remain current through IPCC AR7 (c. 2028–2030)
Current figure
The Shared Socioeconomic Pathways (SSPs) are not a single numerical indicator but a framework of five distinct global scenarios—SSP1 (Sustainability), SSP2 (Middle of the Road), SSP3 (Regional Rivalry), SSP4 (Inequality), and SSP5 (Fossil-fueled Development). Each SSP describes a plausible future trajectory for key socioeconomic drivers such as population, economic growth, technological change, and governance. The current set of SSPs was developed for the climate research community and is used in the Coupled Model Intercomparison Project Phase 6 (CMIP6) and the Intergovernmental Panel on Climate Change (IPCC) Sixth Assessment Report (AR6). The quantitative projections are maintained in the SSP Database (version 2.0) hosted by the International Institute for Applied Systems Analysis (IIASA), last updated in 2018.
Measurement date
The SSP narratives and quantitative elements were published in a series of papers in 2017 (Riahi et al., 2017; O’Neill et al., 2017). The underlying SSP Database version 2.0 was released in 2018 and contains projections for the period 2010–2100 at five-year intervals. The framework itself is not updated on a regular schedule; it represents a fixed set of scenarios designed to serve as a common reference for climate research over a multi-year assessment cycle. The current SSPs are the latest generation, succeeding the Special Report on Emissions Scenarios (SRES) from 2000.
Previous figure
Before the SSPs, the climate research community used the SRES scenarios (Nakićenović et al., 2000), which comprised four main storylines: A1, A2, B1, and B2. These scenarios projected socioeconomic and emissions trajectories without explicit climate policy. The shift from SRES to SSPs represents a fundamental change in scenario architecture. While SRES combined socioeconomic and emissions pathways into single storylines, the SSPs decouple socioeconomic development from climate policy, allowing researchers to pair any SSP with different levels of radiative forcing (e.g., SSP1-2.6, SSP5-8.5). This change provides greater flexibility and a more systematic exploration of future uncertainties. The SSPs also incorporate updated historical data, improved modeling of land use and energy systems, and a wider range of socioeconomic assumptions.
Long-term trend
The evolution of global scenario frameworks reflects the increasing sophistication of climate change research. Early scenarios (e.g., SA90, IS92) provided simple emissions pathways. The SRES scenarios (2000) introduced narrative-based storylines. The Representative Concentration Pathways (RCPs) (2011) focused on radiative forcing levels. The SSPs (2017) added detailed socioeconomic dimensions, enabling analysis of both climate impacts and mitigation/adaptation challenges. The table below summarizes the five SSP narratives.
| SSP | Name | Narrative | Challenges to Mitigation | Challenges to Adaptation |
|---|---|---|---|---|
| SSP1 | Sustainability – Taking the Green Road | A world of rapid technological progress, low population growth, high environmental awareness, and inclusive development. | Low | Low |
| SSP2 | Middle of the Road | Trends follow historical patterns; development and income growth proceed unevenly, with moderate progress toward sustainability. | Medium | Medium |
| SSP3 | Regional Rivalry – A Rocky Road | Resurgent nationalism, regional conflicts, and slow economic growth; high population growth in developing countries. | High | High |
| SSP4 | Inequality – A Road Divided | Highly unequal world; a small elite controls resources, while a large vulnerable population faces high adaptation challenges. | Low | High |
| SSP5 | Fossil-fueled Development – Taking the Highway | Rapid economic growth driven by fossil fuels, high technology optimism, and high human capital; low population growth. | High | Low |
Source: O’Neill et al. (2017).
Data source
The authoritative source for SSP data is the SSP Database hosted by IIASA (https://tntcat.iiasa.ac.at/SspDb). The database provides quantitative projections for population, GDP, urbanization, and emissions (including CO₂, CH₄, N₂O) for each SSP, both as baseline (no climate policy) and mitigation scenarios. The underlying research was published in two key papers: Riahi et al. (2017) “The Shared Socioeconomic Pathways and their energy, land use, and greenhouse gas emissions implications: An overview” (Global Environmental Change, 42, 153–168) and O’Neill et al. (2017) “The roads ahead: Narratives for shared socioeconomic pathways describing world futures in the 21st century” (Global Environmental Change, 42, 169–180). The SSPs are also documented in the IPCC AR6 Working Group I and III reports.
Methodology
The SSPs were developed through a multi-year, community-driven process. Narratives were created by an international team of researchers based on a matrix of challenges to mitigation and adaptation. Quantitative projections were produced by six integrated assessment models (IAMs): AIM/CGE, GCAM, IMAGE, MESSAGE-GLOBIOM, REMIND-MAgPIE, and WITCH. Each model generated a set of baseline and mitigation scenarios consistent with the SSP storylines. The marker scenarios—one per SSP—were selected to represent the central tendency of the model ensemble. Key variables such as population and GDP were harmonized across models using common historical data and assumptions. The SSP Database version 2.0 contains over 1,000 scenario variants, but the five marker baseline scenarios are the most widely used.
Why annual values fluctuate
SSP projections are not observed annual values; they are scenario-based pathways that do not fluctuate in the same way as real-world data. However, the underlying models produce year-to-year variations in some variables (e.g., emissions) due to assumptions about economic cycles, technology adoption, and policy implementation. In the real world, the relevance of a particular SSP may shift as new data emerge—for example, recent global emissions trends have been closer to SSP2-4.5 or SSP3-7.0 than to the most extreme SSP5-8.5. The SSP framework itself is static, but researchers periodically compare actual developments against the scenarios to assess which pathways remain plausible.
Regional variation
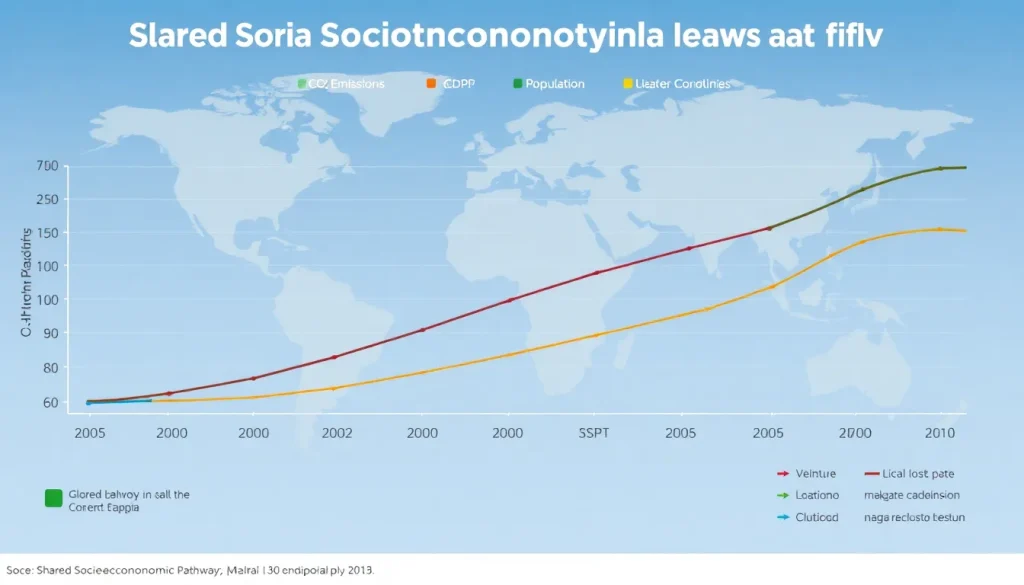
The SSPs include regional detail for five broad world regions (OECD, Asia, Latin America, Middle East and Africa, and Reforming Economies) and, in some models, for individual countries. The table below shows projected population and GDP for each SSP in 2100, aggregated globally, based on the marker baseline scenarios from the SSP Database (version 2.0).
| SSP | Global Population in 2100 (billions) | Global GDP in 2100 (trillion 2005 USD) | CO₂ Emissions in 2100 (GtC/yr, baseline) |
|---|---|---|---|
| SSP1 | 6.9 | 350 | 7.5 |
| SSP2 | 9.0 | 250 | 16.0 |
| SSP3 | 12.6 | 150 | 29.0 |
| SSP4 | 9.3 | 220 | 15.0 |
| SSP5 | 7.4 | 500 | 25.0 |
Note: Values are approximate and rounded. CO₂ emissions are from fossil fuels and industry only. Source: IIASA SSP Database (2018). Regional breakdowns show that population growth is concentrated in Africa and parts of Asia under SSP3 and SSP4, while SSP1 and SSP5 assume lower fertility and higher migration. GDP per capita varies widely, with SSP4 showing extreme within-region inequality.
Meaning and limitations
The SSPs are not predictions or forecasts; they are “what-if” scenarios that explore the consequences of different socioeconomic assumptions. They help researchers and policymakers understand the range of possible futures and the implications for climate change, impacts, and policy responses. The SSPs do not assign probabilities to any pathway. Their main limitation is that they are based on current understanding and models, which may not capture all future developments (e.g., disruptive technologies, geopolitical shifts). Additionally, the baseline scenarios assume no new climate policies beyond those already in place, which may not reflect actual policy trajectories. Users should treat the SSPs as tools for analysis rather than as predictions of the future.
Next expected update
There is no officially announced timeline for a new generation of socioeconomic scenarios. The SSPs are expected to remain the primary framework through the IPCC Seventh Assessment Report (AR7) cycle, which is anticipated around 2028–2030. Any update would likely be developed by the climate research community in coordination with the IPCC. In the meantime, the SSP Database may be periodically extended with new model runs or harmonized data, but the core narratives and marker scenarios are considered stable.
Downloadable chart or table
The table below provides key global indicators for the five SSP marker baseline scenarios in 2100, as available from the IIASA SSP Database. Readers can download the full dataset, including regional and sectoral detail, from https://tntcat.iiasa.ac.at/SspDb.
| SSP | Population (billions) | GDP (trillion 2005 USD) | CO₂ (GtC/yr) | CH₄ (MtCH₄/yr) | N₂O (MtN₂O/yr) |
|---|---|---|---|---|---|
| SSP1 | 6.9 | 350 | 7.5 | 380 | 6.5 |
| SSP2 | 9.0 | 250 | 16.0 | 620 | 9.0 |
| SSP3 | 12.6 | 150 | 29.0 | 950 | 12.0 |
| SSP4 | 9.3 | 220 | 15.0 | 580 | 8.5 |
| SSP5 | 7.4 | 500 | 25.0 | 850 | 10.5 |
Note: All values are for 2100 and are rounded. CO₂ emissions are from fossil fuels and industry. CH₄ and N₂O are total anthropogenic emissions. Source: IIASA SSP Database version 2.0 (2018).
FAQ
What are the Shared Socioeconomic Pathways (SSPs)?
The SSPs are five global scenarios (SSP1–SSP5) that describe alternative future trajectories for society and the economy through 2100. They cover population, economic growth, technological change, and governance, and are used in climate research to assess challenges to mitigation and adaptation.
How do SSPs differ from RCPs?
RCPs (Representative Concentration Pathways) describe different levels of greenhouse gas concentrations and radiative forcing. SSPs describe the socioeconomic conditions that could lead to those emissions. They are often combined (e.g., SSP2-4.5) to create integrated scenarios that include both societal and physical climate dimensions.
Are the SSPs predictions of the future?
No. The SSPs are not forecasts; they are plausible ‘what-if’ scenarios designed to explore a range of possible futures. They do not assign probabilities and should be used as tools for analysis, not as predictions.
References
- Riahi, K. et al. (2017). The Shared Socioeconomic Pathways and their energy, land use, and greenhouse gas emissions implications: An overview. Global Environmental Change, 42, 153–168.
- O’Neill, B. C. et al. (2017). The roads ahead: Narratives for shared socioeconomic pathways describing world futures in the 21st century. Global Environmental Change, 42, 169–180.
- IIASA SSP Database version 2.0 (2018). Available at https://tntcat.iiasa.ac.at/SspDb.
- IPCC (2021). Climate Change 2021: The Physical Science Basis. Contribution of Working Group I to the Sixth Assessment Report.
- Nakićenović, N. et al. (2000). Special Report on Emissions Scenarios (SRES). Cambridge University Press.