In brief
At a glance
Quick Facts
- Standardized framework
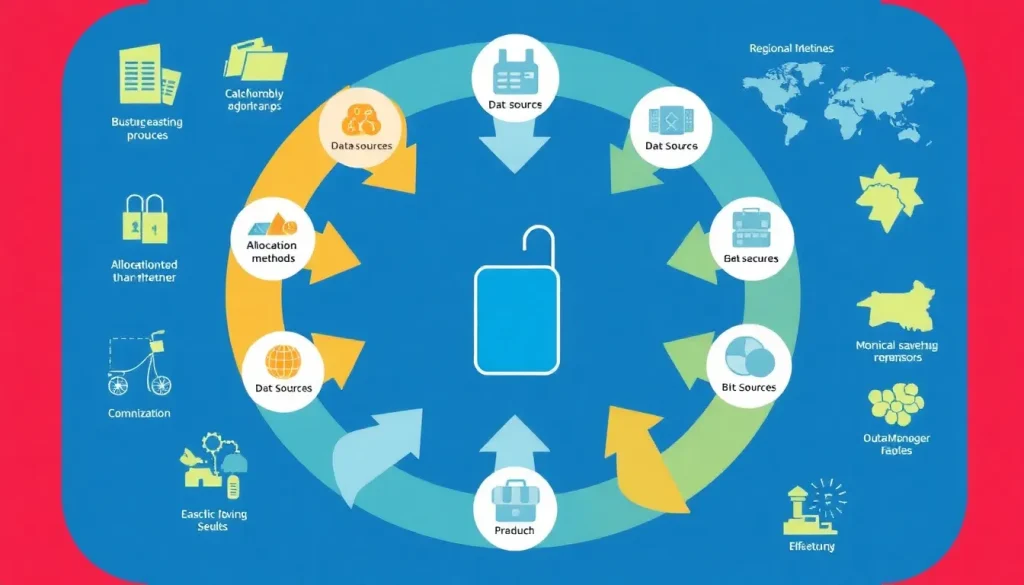
- ISO 14040 and 14044 provide principles and requirements for LCA, but allow methodological flexibility.
- Phases of LCA
- Goal and scope definition, life-cycle inventory analysis, life-cycle impact assessment, and interpretation.
- Common functional units
- Per kilogram of material, per liter of beverage, per square meter of flooring, per functional service delivered.
- Allocation methods
- System expansion, physical allocation, economic allocation, and substitution are used to partition environmental burdens among co-products.
- Impact categories
- LCAs typically assess global warming potential, acidification, eutrophication, resource depletion, and human toxicity, among others.
- Data sources
- Primary data from specific processes, secondary data from databases like ecoinvent or GaBi, and literature estimates.
- Regional variability
- Electricity grid mix, transport distances, and waste treatment technologies differ by region, affecting LCA results.
- Uncertainty
- LCA results are subject to parameter, scenario, and model uncertainty, often addressed through sensitivity analysis.
Key Takeaways
- Life-cycle assessments (LCAs) can produce different results for the same product because they are models that depend on methodological choices, data sources, and assumptions, all of which can vary between studies.
- The definition of the system boundary—what is included or excluded from the analysis—is a primary driver of divergent outcomes, as it determines which environmental flows are accounted for.
- Allocation methods for multi-functional processes, the selection of impact assessment models, and regional differences in energy and material production further contribute to variability.
- Recognizing and transparently reporting these sources of variation is essential for credible LCA practice and for using results appropriately in decision-making.
What Is Why Life-Cycle Assessments Produce Different Results?
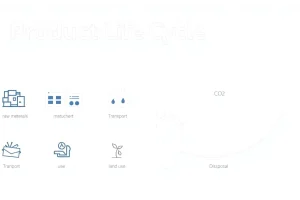
Life-cycle assessment (LCA) is a standardized methodology for evaluating the environmental impacts of a product, process, or service across its entire life cycle—from raw material extraction and manufacturing to use and end-of-life management. Despite the existence of international standards such as ISO 14040 and ISO 14044, LCAs of the same product often yield different, sometimes contradictory, results. This phenomenon is not a failure of the methodology but an inherent characteristic of any complex modeling exercise. LCA requires practitioners to make numerous choices about system boundaries, data sources, allocation procedures, and impact assessment methods, each of which can significantly influence the final outcome. Understanding why these differences occur is essential for interpreting LCA results, comparing studies, and using them to inform environmental policy, product design, and consumer behavior.
At its core, an LCA is a simplification of reality. No study can capture every environmental interaction of a product system; instead, the practitioner must decide which processes to include, which data to use, and how to translate inventory flows into environmental impacts. These decisions are guided by the goal and scope of the study, but even with a well-defined goal, multiple valid approaches exist. Consequently, two LCAs of the same product can both be compliant with ISO standards yet produce different results. The variability is not a sign of error but a reflection of the complexity of environmental systems and the choices made to model them. This article explores the key reasons behind these differences, providing a framework for understanding and critically evaluating LCA results.
How It Works
To understand why LCA results differ, one must first grasp the basic structure of an LCA. The ISO 14040 standard divides LCA into four interrelated phases: goal and scope definition, life-cycle inventory (LCI) analysis, life-cycle impact assessment (LCIA), and interpretation. Each phase involves decisions that can alter the final outcome.

In the goal and scope definition, the practitioner sets the study’s purpose, the functional unit (the quantified performance of the product system to be used as a reference), and the system boundaries. The functional unit is critical because it defines what is being compared. For example, comparing the environmental impact of a paper bag versus a plastic bag requires a functional unit such as “carrying a certain volume of groceries over a specified distance.” If one study uses a single-use functional unit and another assumes multiple reuses, results will diverge. System boundaries determine which life-cycle stages are included—cradle-to-gate, cradle-to-grave, or gate-to-gate—and which processes are cut off. A study that excludes capital goods or infrastructure may yield lower impacts than one that includes them.
The life-cycle inventory (LCI) phase involves collecting data on all inputs (e.g., raw materials, energy) and outputs (e.g., emissions, waste) for each unit process within the system boundary. Data can come from primary sources (direct measurements) or secondary databases. The choice of database, the age of the data, and the geographical representativeness all introduce variability. For example, electricity generation data from a coal-heavy grid will produce a higher carbon footprint than data from a grid with more renewables, even for the same product.
In the life-cycle impact assessment (LCIA) phase, inventory data are translated into environmental impact scores using characterization factors. Different LCIA methods (e.g., ReCiPe, TRACI, CML) use different models and substance coverage, leading to different results. For instance, one method may weight methane’s global warming potential differently over a 100-year time horizon. Finally, the interpretation phase identifies significant issues and evaluates completeness, sensitivity, and consistency, but it does not eliminate the underlying variability.
Main Causes or Drivers
Several specific factors drive the divergence in LCA results. These can be grouped into methodological choices, data-related issues, and contextual factors.
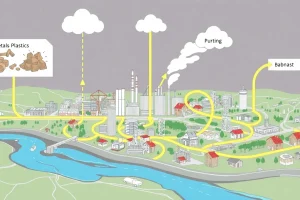
- System boundary definition: The decision to include or exclude certain life-cycle stages, such as capital goods, infrastructure, or end-of-life recycling, can dramatically change results. A cradle-to-gate study will miss use-phase and disposal impacts, while a cradle-to-grave study may include them. Even within the same scope, cut-off criteria (e.g., mass, energy, or environmental significance) can exclude minor flows that cumulatively matter.
- Functional unit and reference flow: The functional unit determines the basis for comparison. If one LCA compares beverages based on volume (per liter) and another based on nutritional content (per serving of protein), the results will differ. The reference flow—the amount of product needed to fulfill the functional unit—also varies with product performance assumptions.
- Allocation methods: Many processes produce multiple co-products (e.g., soybean oil and meal, or milk and meat from dairy systems). Allocation partitions the environmental burdens among these products. Common methods include physical allocation (based on mass or energy content), economic allocation (based on market value), and system expansion (avoiding allocation by including the co-product’s function). Each method can assign a different share of impacts to the main product, leading to different results.
- Data sources and quality: LCAs rely on databases that may use industry-average data, outdated figures, or data from different regions. Primary data from a specific factory may differ from generic data. Temporal mismatches (e.g., using data from 2010 for a 2025 study) and technological differences (e.g., best available technology vs. average) also cause variation.
- Impact assessment models: The choice of LCIA method affects which environmental issues are considered and how they are characterized. Some methods include more impact categories (e.g., land use, water scarcity) than others. Characterization factors for the same substance can differ between methods due to different modeling assumptions, time horizons, or geographic specificity.
- Assumptions and scenarios: LCAs often require assumptions about transport distances, consumer behavior, product lifetime, and end-of-life treatment. For example, assuming a high recycling rate versus landfilling can reverse the comparative advantage of one material over another. These scenarios are often based on projections or averages that may not reflect real-world variability.
Data Limitations and Uncertainties
Data quality is a pervasive source of variability in LCA. Practitioners often face gaps in available data, forcing them to use proxy data, estimates, or industry averages. Secondary databases, while comprehensive, may not accurately represent the specific supply chain of the product under study. For example, a generic dataset for steel production may not capture the efficiency improvements or emission controls of a particular mill. Temporal uncertainty arises when data are collected at different times; a study using older data may not reflect current technology or energy mixes.
Geographical uncertainty is another major factor. Using European electricity grid data for a product manufactured in China will misrepresent the carbon footprint. Similarly, transportation distances and modes can vary widely. LCA practitioners often address these uncertainties through sensitivity analysis, varying key parameters to see how results change. However, the range of possible outcomes can be large, and different studies may explore different sensitivity scenarios, leading to different conclusions. The lack of a universally accepted method for uncertainty analysis further contributes to variability in reported results.
Regional Differences
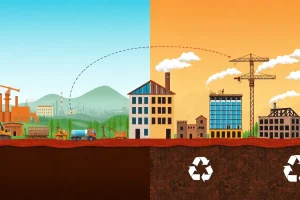
The environmental profile of a product is heavily influenced by where its life-cycle stages occur. Energy systems are a prime example: a product manufactured in a region with a high share of coal-fired electricity will have a larger carbon footprint than the same product made in a region with hydropower or nuclear energy. This is why location-specific electricity data are crucial. Similarly, the efficiency of manufacturing processes, the availability of recycled content, and the waste management infrastructure differ by country and region.
Transportation distances also vary regionally. A product assembled from globally sourced components may have a higher transportation impact than one using local suppliers. End-of-life treatment is another regional variable: in some areas, high recycling rates and advanced waste-to-energy facilities reduce impacts, while in others, landfilling predominates. Even agricultural products show regional differences due to climate, soil, and farming practices. Thus, an LCA conducted for a product in one region cannot be directly applied to another without adjustments, and comparisons between products from different regions must account for these contextual factors.
Benefits, Limitations and Trade-offs
LCA is a powerful tool for identifying environmental hotspots and avoiding burden shifting—where solving one problem creates another. However, its inherent variability is both a limitation and a strength. The flexibility allows LCA to be tailored to specific decision contexts, but it also means that results are not absolute truths. A key trade-off is between comprehensiveness and precision: a more detailed, site-specific LCA may be more accurate but less comparable to other studies, while a generic LCA may be comparable but less representative.
Another limitation is that LCA typically does not account for spatial and temporal variation in impacts, such as the local effects of emissions. The results are often aggregated into single scores, which can obscure trade-offs between impact categories. For example, a product may have a lower carbon footprint but higher ecotoxicity. Different weighting methods can lead to different overall conclusions. Recognizing these limitations is essential for using LCA responsibly. The variability in results underscores the need for transparency, critical review, and the use of multiple scenarios to support robust decision-making.
Common Misconceptions
A common misconception is that LCA provides a single, objective environmental score that can definitively rank products. In reality, LCA is a decision-support tool, not a measurement device. Different results do not necessarily mean one study is wrong; they often reflect different, equally valid methodological choices. Another misconception is that ISO standards prescribe a single correct way to conduct an LCA. The standards provide a framework and requirements but allow flexibility in many areas, which is why variability persists.
Some believe that using a well-known database or software guarantees consistent results. However, databases contain choices and averages, and software implements different calculation methods. The interpretation of LCA results also requires expertise; a lower impact in one category does not automatically make a product “greener” overall. Finally, the idea that LCA results are static is misleading. As data improve, methods evolve, and production systems change, LCA results can and should be updated, leading to different outcomes over time.
FAQ
What is a life-cycle assessment?
A life-cycle assessment (LCA) is a systematic analysis of the environmental impacts of a product, process, or service throughout its entire life cycle, from raw material extraction to end-of-life disposal or recycling.
How can two LCAs of the same product give different results?
Differences arise from choices in system boundaries, data sources, allocation methods, impact assessment models, and regional parameters. Even small variations in these factors can lead to divergent outcomes.
Why does LCA variability matter?
It matters because LCA results are used to guide policy, product design, and consumer choices. Misinterpreting or ignoring variability can lead to suboptimal environmental decisions or greenwashing.
References
- ISO 14040:2006 Environmental management — Life cycle assessment — Principles and framework
- ISO 14044:2006 Environmental management — Life cycle assessment — Requirements and guidelines
- European Commission Joint Research Centre, International Reference Life Cycle Data System (ILCD) Handbook