In brief
At a glance
Quick Facts
- Current figure
- CO₂: 36.8 GtCO₂ (2023 prelim); CO₂e: 57.4 GtCO₂e (2022)
- Measurement date
- 2023 for CO₂, 2022 for CO₂e
- Previous figure
- CO₂: 36.6 GtCO₂ (2022); CO₂e: 56.5 GtCO₂e (2021)
- Change
- CO₂: +0.2 GtCO₂ (+0.5%); CO₂e: +0.9 GtCO₂e (+1.6%)
- Data source
- Global Carbon Project, UNEP
- Next update
- December 2024 (CO₂), November 2024 (CO₂e)
Current figure
Global carbon dioxide (CO₂) emissions from fossil fuels and industry are estimated at 36.8 billion tonnes (GtCO₂) for the year 2023, according to the Global Carbon Project’s preliminary data released in December 2023. Total anthropogenic greenhouse gas (GHG) emissions, expressed in CO₂-equivalent (CO₂e), reached 57.4 GtCO₂e in 2022, as reported by the United Nations Environment Programme (UNEP) in its Emissions Gap Report 2023. The CO₂e figure includes CO₂, methane (CH₄), nitrous oxide (N₂O), and fluorinated gases, weighted by their 100-year global warming potentials (GWP-100) from the IPCC Sixth Assessment Report (AR6).
Measurement date
The CO₂ figure of 36.8 GtCO₂ is a preliminary estimate for the full year 2023, released in December 2023. The CO₂e figure of 57.4 GtCO₂e refers to the year 2022, as reported in November 2023. Both datasets are updated annually: the Global Carbon Budget is published each December, and the UNEP Emissions Gap Report is released each November, typically covering the previous year’s emissions.
Previous figure
In 2022, global CO₂ emissions from fossil fuels and industry were 36.6 GtCO₂ (Global Carbon Budget 2023). The 2023 preliminary estimate of 36.8 GtCO₂ represents an increase of 0.2 GtCO₂, or approximately 0.5%. For total GHG emissions in CO₂e, the 2021 value was 56.5 GtCO₂e (UNEP Emissions Gap Report 2023), so the 2022 figure of 57.4 GtCO₂e marks an increase of 0.9 GtCO₂e, or about 1.6%.
Long-term trend
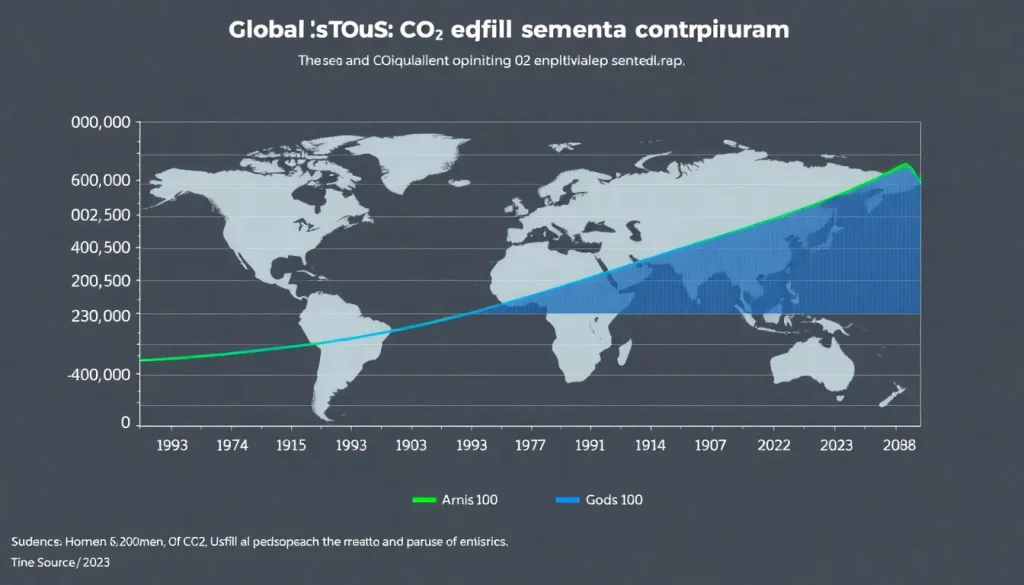
Global CO₂ emissions have risen steadily since the mid-20th century, with temporary dips during economic recessions and the COVID-19 pandemic. Total GHG emissions (CO₂e) follow a similar trajectory, with non-CO₂ gases contributing a relatively stable share. The table below shows decadal averages and recent annual values.
| Year | CO₂ emissions (GtCO₂) | Total GHG emissions (GtCO₂e) |
|---|---|---|
| 1990 | 22.8 | ~38 |
| 2000 | 25.6 | ~42 |
| 2010 | 33.3 | ~51 |
| 2019 | 36.7 | ~59 |
| 2020 | 34.8 | ~55 |
| 2021 | 36.3 | 56.5 |
| 2022 | 36.6 | 57.4 |
| 2023 | 36.8 (prelim.) | N/A |
Sources: CO₂ data from Global Carbon Budget 2023; CO₂e data from UNEP Emissions Gap Report 2023 and EDGAR v7.0 for earlier years. Note that CO₂e values are approximate for years before 2021 due to varying methodologies.
Data source
CO₂ emissions data are from the Global Carbon Project (Global Carbon Budget 2023, published in Earth System Science Data). Total greenhouse gas emissions in CO₂-equivalent are from the United Nations Environment Programme (UNEP) Emissions Gap Report 2023, which draws on the EDGAR (Emissions Database for Global Atmospheric Research) v7.0 dataset and other national inventories. Global warming potential (GWP) values are from the IPCC Sixth Assessment Report (AR6), Working Group I, Chapter 7.
Methodology
CO₂ emissions are estimated based on fossil fuel combustion, industrial processes (e.g., cement production), and land-use change. The Global Carbon Project combines energy statistics, cement production data, and other activity data with emission factors. CO₂-equivalent (CO₂e) is a metric that converts emissions of non-CO₂ greenhouse gases (CH₄, N₂O, HFCs, PFCs, SF₆, NF₃) into the equivalent amount of CO₂ based on their global warming potential (GWP) over a specified time horizon, typically 100 years. For example, methane has a GWP-100 of 27–30 (IPCC AR6), meaning 1 tonne of methane is equivalent to 27–30 tonnes of CO₂. The UNEP report aggregates national inventories and uses GWP-100 values from the IPCC AR6. Uncertainties arise from activity data, emission factors, and GWP choices.
Why annual values fluctuate
Year-to-year changes in CO₂ and CO₂e emissions are driven by economic growth, energy demand, weather patterns (affecting heating/cooling), and policy changes. For CO₂, fluctuations in coal and natural gas use are major factors. For CO₂e, methane emissions from agriculture and fossil fuel extraction can vary, and fluorinated gas emissions depend on industrial activity. The COVID-19 pandemic caused a sharp drop in 2020, followed by a rebound. Annual updates also reflect improved data and methodology revisions.
Regional variation
Emissions vary widely by country and region. The table below shows the top emitters of CO₂ and total GHG in 2022 (preliminary).
| Country/Region | CO₂ emissions (GtCO₂, 2022) | Total GHG emissions (GtCO₂e, 2022) |
|---|---|---|
| China | 11.4 | ~14.5 |
| United States | 5.1 | ~6.0 |
| India | 2.9 | ~3.5 |
| EU27 | 2.8 | ~3.4 |
| Russia | 1.7 | ~2.5 |
Sources: CO₂ data from Global Carbon Budget 2023; total GHG estimates from EDGAR v7.0 (2022) and national reports. CO₂e values are approximate and include LULUCF for some countries. Per capita emissions show a different pattern, with high values in oil-producing nations and developed countries.
Meaning and limitations
CO₂ is the most important long-lived greenhouse gas, responsible for about 75% of the increase in radiative forcing since pre-industrial times. CO₂-equivalent provides a single metric to compare the climate impact of different gases, but it simplifies complex atmospheric processes. The choice of time horizon (e.g., GWP-100 vs GWP-20) significantly affects the weighting of short-lived gases like methane. CO₂e values also depend on the GWP values used (IPCC AR5 vs AR6). Additionally, CO₂e does not capture regional or temporal variations in forcing, and it does not account for carbon cycle feedbacks. The figures presented are global totals and mask large disparities in historical responsibility and per capita emissions.
Next expected update
The Global Carbon Budget 2024, providing preliminary CO₂ emissions for 2024 and final 2023 data, is expected in December 2024. The UNEP Emissions Gap Report 2024, with total GHG emissions for 2023, is anticipated in November 2024. Both are annual publications.
Downloadable chart or table
The table below provides key historical data points for global CO₂ and CO₂e emissions. The underlying datasets can be downloaded from the Global Carbon Project website (globalcarbonbudget.org) and the EDGAR database (edgar.jrc.ec.europa.eu).
| Year | CO₂ (GtCO₂) | CO₂e (GtCO₂e) |
|---|---|---|
| 2010 | 33.3 | 51.0 |
| 2011 | 34.0 | 52.0 |
| 2012 | 34.4 | 52.5 |
| 2013 | 34.8 | 53.0 |
| 2014 | 35.0 | 53.5 |
| 2015 | 35.1 | 53.7 |
| 2016 | 35.2 | 53.8 |
| 2017 | 35.8 | 54.5 |
| 2018 | 36.4 | 55.6 |
| 2019 | 36.7 | 59.0 |
| 2020 | 34.8 | 55.0 |
| 2021 | 36.3 | 56.5 |
| 2022 | 36.6 | 57.4 |
Note: CO₂e values for 2010–2018 are approximate, based on EDGAR v5.0 and earlier UNEP reports; 2019–2022 from UNEP 2023. CO₂ data from Global Carbon Budget 2023.
FAQ
What is the difference between CO₂ and CO₂-equivalent?
CO₂ refers specifically to carbon dioxide gas, the primary greenhouse gas emitted through human activities. CO₂-equivalent (CO₂e) is a metric that includes CO₂ plus other greenhouse gases (such as methane and nitrous oxide), with each gas weighted by its global warming potential (GWP) to express its climate impact in terms of the equivalent amount of CO₂. This allows for a single, comparable measure of total greenhouse gas emissions.
Why is CO₂-equivalent used instead of just CO₂?
CO₂-equivalent is used because different greenhouse gases have different abilities to trap heat and different atmospheric lifetimes. By converting all gases to a common scale, policymakers and scientists can compare the total warming effect of emissions from various sources and design comprehensive mitigation strategies. It also simplifies reporting and target-setting under international climate agreements.
How are global warming potential (GWP) values determined?
GWP values are calculated by climate scientists using complex atmospheric models that simulate the radiative forcing and lifetime of each gas. The Intergovernmental Panel on Climate Change (IPCC) periodically updates these values in its assessment reports. The most common time horizon is 100 years (GWP-100), but other horizons (20, 500 years) are also used. The choice of time horizon and the inclusion of climate-carbon feedbacks can affect the GWP values.
References
- Global Carbon Project. (2023). Global Carbon Budget 2023. Earth System Science Data.
- United Nations Environment Programme. (2023). Emissions Gap Report 2023: Broken Record – Temperatures hit new highs, yet world fails to cut emissions (again). Nairobi.
- IPCC. (2021). Climate Change 2021: The Physical Science Basis. Contribution of Working Group I to the Sixth Assessment Report. Chapter 7: The Earth's Energy Budget, Climate Feedbacks, and Climate Sensitivity.
- European Commission, Joint Research Centre (JRC)/Netherlands Environmental Assessment Agency (PBL). (2022). EDGAR v7.0 Greenhouse Gas Emissions.
- Friedlingstein, P., et al. (2023). Global Carbon Budget 2023. Earth System Science Data, 15, 5301–5369.