In brief
At a glance
Quick Facts
- Current figure
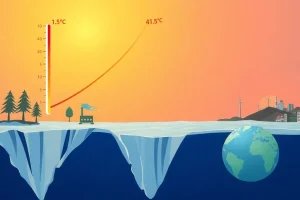
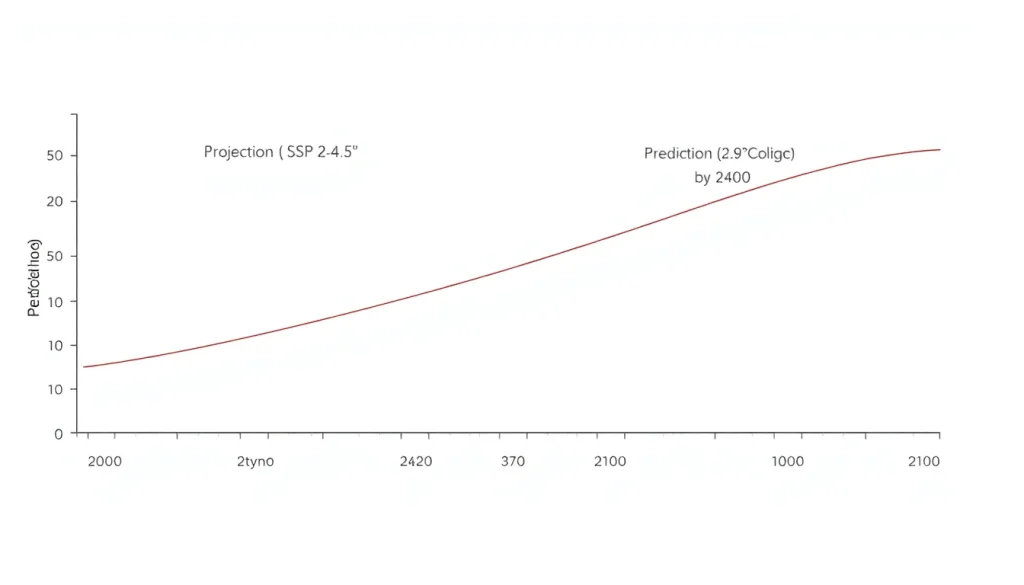
- Projection: 1.5°C warming by 2040 (SSP2-4.5); Prediction: 2.7°C by 2100 (current policies)
- Measurement date
- Projection: IPCC AR6 (2021); Prediction: Climate Action Tracker (Nov 2023)
- Previous figure
- Projection: 1.4°C by 2040 (AR5, 2013); Prediction: 2.9°C by 2100 (CAT, 2021)
- Change
- Projection: +0.1°C; Prediction: -0.2°C since 2021
- Data source
- IPCC AR6 WGI; Climate Action Tracker
- Next update
- Projection: IPCC AR7 (~2028–2029); Prediction: CAT late 2024/early 2025
Current figure
As of the latest IPCC Sixth Assessment Report (AR6) published in 2021–2023, the best estimate for global surface temperature increase by 2040 relative to 1850–1900 is approximately 1.5°C under the SSP2-4.5 scenario (a middle-of-the-road projection). In contrast, a prediction based on current policies and pledges, as assessed by Climate Action Tracker in November 2023, estimates a warming of 2.7°C by 2100. These figures illustrate the difference: a projection is a ‘what-if’ scenario outcome, while a prediction is a forecast of the most likely actual outcome given current conditions.
Measurement date
The IPCC AR6 Working Group I report was released in August 2021, with data reflecting climate model simulations run as part of the Coupled Model Intercomparison Project Phase 6 (CMIP6). The Climate Action Tracker update is from November 2023. Projections are typically updated with each IPCC assessment cycle (every 6–7 years), while predictions based on policy trajectories are updated more frequently, often annually.
Previous figure
In the IPCC Fifth Assessment Report (AR5, 2013–2014), the projected warming by 2040 under the RCP4.5 scenario (comparable to SSP2-4.5) was approximately 1.4°C above pre-industrial levels. The current projection of 1.5°C represents an increase of 0.1°C, partly due to updated model physics and higher near-term warming rates. For predictions, the Climate Action Tracker’s estimate of 2.7°C by 2100 in 2023 is unchanged from its 2022 estimate, but down from 2.9°C in 2021, reflecting updated policy pledges.
Long-term trend
Climate model projections have consistently shown warming trends over the past decades. The following table summarizes the evolution of projected warming by 2100 under business-as-usual scenarios across IPCC reports:
| IPCC Report | Year | Scenario | Projected Warming by 2100 (°C) |
|---|---|---|---|
| FAR | 1990 | Business-as-usual | 3.0°C (2.0–5.0) |
| SAR | 1995 | IS92a | 2.0°C (1.0–3.5) |
| TAR | 2001 | SRES A2 | 3.0°C (1.3–4.5) |
| AR4 | 2007 | SRES A2 | 3.4°C (2.0–5.4) |
| AR5 | 2013 | RCP8.5 | 3.7°C (2.6–4.8) |
| AR6 | 2021 | SSP5-8.5 | 4.4°C (3.3–5.7) |
Note: These are projections under high-emission scenarios, not predictions. The increase in projected warming over time reflects improved model sensitivity and inclusion of carbon cycle feedbacks, not necessarily a worsening of the actual trajectory.
Data source
The primary data source for climate projections is the Intergovernmental Panel on Climate Change (IPCC), specifically the Working Group I contribution to the Sixth Assessment Report (AR6). The projections are based on simulations from the Coupled Model Intercomparison Project Phase 6 (CMIP6). Predictions based on current policies are sourced from the Climate Action Tracker (CAT), a consortium of Climate Analytics and NewClimate Institute, with its latest update in November 2023.
Methodology
Model projections are generated by running global climate models under prescribed scenarios of future greenhouse gas concentrations, aerosols, and land-use change (Shared Socioeconomic Pathways, SSPs). These scenarios are not predictions; they represent plausible future pathways. Predictions, on the other hand, integrate current policies, pledges, and observed trends to estimate the most likely outcome. For example, the Climate Action Tracker combines national pledges, policy analysis, and a climate model emulator to estimate warming by 2100. The distinction is crucial: projections answer ‘what if,’ while predictions answer ‘what will most likely happen.’
Why annual values fluctuate
Year-to-year fluctuations in global temperature are driven by natural variability, such as El Niño and La Niña events, volcanic eruptions, and solar cycles. These short-term variations do not reflect the long-term trend. Model projections smooth out such variability by averaging over many simulations or focusing on long-term means. Predictions, especially near-term, may incorporate observed initial conditions and thus show more year-to-year variability. The difference between a projection and a prediction can also fluctuate as policies and technologies evolve.
Regional variation
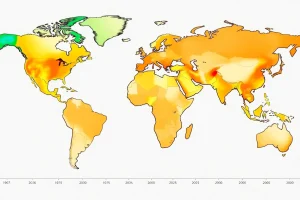
Projections and predictions vary significantly by region. For instance, the IPCC AR6 projects that under SSP2-4.5, the Arctic will warm more than twice the global average by 2040. Predictions of regional impacts, such as sea-level rise or heat extremes, also show strong spatial variation. The table below shows projected temperature changes by region for 2040 under SSP2-4.5 (relative to 1995–2014):
| Region | Projected Warming (°C) |
|---|---|
| Global | 1.5 |
| Arctic | 3.0–4.0 |
| North America | 1.5–2.5 |
| Europe | 1.5–2.5 |
| Africa | 1.0–2.0 |
| Asia | 1.5–2.5 |
Source: IPCC AR6 WGI Interactive Atlas, 2021.
Meaning and limitations
Model projections are not forecasts; they are conditional statements about the climate system’s response to specified forcing scenarios. They do not predict future socioeconomic pathways. Predictions, while attempting to forecast the most likely outcome, are subject to uncertainties in policy implementation, technological change, and human behavior. Both are limited by model resolution, incomplete understanding of feedbacks, and natural variability. Users should not interpret a single projection as a prediction, nor should they assume that predictions are certain.
Next expected update
The next major update of climate model projections is expected with the IPCC Seventh Assessment Report (AR7), likely around 2028–2029. The Climate Action Tracker updates its warming predictions periodically, with the next update anticipated in late 2024 or early 2025, following the annual UNFCCC COP meetings where new pledges may be announced.
Downloadable chart or table
The table below provides key historical and current projection data. The full CMIP6 dataset is available from the Earth System Grid Federation (ESGF) at https://esgf-node.llnl.gov. Climate Action Tracker data can be downloaded from https://climateactiontracker.org.
| Source | Scenario/Prediction | Warming by 2100 (°C) | Year of Estimate |
|---|---|---|---|
| IPCC AR6 | SSP1-1.9 (very low emissions) | 1.4 (1.0–1.8) | 2021 |
| IPCC AR6 | SSP1-2.6 (low emissions) | 1.8 (1.3–2.4) | 2021 |
| IPCC AR6 | SSP2-4.5 (intermediate emissions) | 2.7 (2.1–3.5) | 2021 |
| IPCC AR6 | SSP3-7.0 (high emissions) | 3.6 (2.8–4.6) | 2021 |
| IPCC AR6 | SSP5-8.5 (very high emissions) | 4.4 (3.3–5.7) | 2021 |
| Climate Action Tracker | Current policies prediction | 2.7 (2.2–3.4) | Nov 2023 |
| Climate Action Tracker | Pledges & targets prediction | 2.1 (1.7–2.6) | Nov 2023 |
FAQ
What is the difference between a model projection and a prediction?
A model projection is a conditional statement about the future based on a set of assumptions (e.g., a specific emissions scenario), without assigning a probability to those assumptions. A prediction is a forecast of the most likely actual outcome, often incorporating current policies, trends, and initial conditions. Projections answer 'what if,' while predictions answer 'what will most likely happen.'
Why are climate model projections not predictions?
Climate model projections are not predictions because they do not attempt to forecast future human behavior, such as policy decisions or technological changes. Instead, they explore a range of plausible futures based on different socioeconomic pathways. The actual future will depend on choices made today, so no single projection can be considered a prediction.
How reliable are climate predictions compared to projections?
Climate predictions, such as those from the Climate Action Tracker, are based on current policies and pledges, which can change. They are reliable as a snapshot of the expected outcome if current trends continue, but they are subject to revision as new policies are enacted. Projections are reliable in showing the physical response of the climate system to a given forcing, but their relevance depends on the scenario chosen. Both have uncertainties, but projections are more robust for exploring ranges of possible futures.
References
- IPCC, 2021: Climate Change 2021: The Physical Science Basis. Contribution of Working Group I to the Sixth Assessment Report of the Intergovernmental Panel on Climate Change. Cambridge University Press.
- Climate Action Tracker (2023). 2100 Warming Projections. Available at: https://climateactiontracker.org/global/temperatures/
- Eyring, V., et al. (2016). Overview of the Coupled Model Intercomparison Project Phase 6 (CMIP6) experimental design and organization. Geoscientific Model Development, 9, 1937–1958.
- IPCC, 2013: Climate Change 2013: The Physical Science Basis. Contribution of Working Group I to the Fifth Assessment Report. Cambridge University Press.
- Hausfather, Z., & Peters, G. P. (2020). Emissions – the 'business as usual' story is misleading. Nature, 577, 618–620.