In brief
At a glance
Quick Facts
- Definition of OHC
- Total thermal energy stored in the ocean, measured in joules.
- Definition of SST
- Temperature of the ocean's surface layer, typically the top millimeter to a few meters.
- Excess Heat Absorption
- The ocean has absorbed more than 90% of the excess heat from greenhouse gas emissions since the 1970s.
- Measurement Methods
- SST is measured by satellites, buoys, and ships; OHC is measured by Argo profiling floats and ship-based instruments.
- Climate Indicator Reliability
- OHC is a more stable indicator of global warming than SST because it is less influenced by short-term weather variability.
- Sea-Level Rise Contribution
- Thermal expansion from rising OHC accounts for about one-third of observed global sea-level rise.
Key Takeaways
- Ocean heat content (OHC) measures the total thermal energy stored in the ocean, while sea-surface temperature (SST) is the temperature of the ocean’s surface layer.
- OHC is a more comprehensive indicator of global warming because the ocean absorbs over 90% of the excess heat from greenhouse gases, with less short-term variability than SST.
- SST is crucial for weather forecasting, hurricane intensity, and marine ecosystem health, but it can fluctuate due to natural phenomena like El Niño.
- Both metrics are essential: OHC reveals long-term climate trends and sea-level rise potential, while SST provides a real-time snapshot of ocean-atmosphere interactions.
What Is Ocean Heat Content vs Sea-Surface Temperature?
Ocean heat content (OHC) is the total amount of thermal energy stored in the ocean, typically measured in joules and integrated from the surface to the seafloor or a reference depth. Sea-surface temperature (SST) is the temperature of the ocean’s uppermost layer—usually the top millimeter to a few meters—measured in degrees Celsius or Fahrenheit. While SST is a familiar metric from weather reports and satellite imagery, OHC represents the vast majority of heat absorbed by the Earth system in response to increasing greenhouse gas concentrations.
The ocean covers about 71% of Earth’s surface and has a high heat capacity, meaning it can absorb large amounts of energy with relatively small temperature changes. This makes OHC a more stable and less noisy indicator of the planet’s energy imbalance than SST or surface air temperature. SST, on the other hand, is directly influenced by atmospheric conditions, ocean currents, and seasonal cycles, making it highly variable on short timescales. Together, these two metrics provide complementary views of the ocean’s thermal state and its role in the climate system.
How It Works
Sea-surface temperature is measured using a combination of satellite-borne infrared and microwave radiometers, as well as in-situ instruments on buoys, ships, and coastal stations. Satellites provide global coverage and high spatial resolution, but they measure only the skin temperature—the top millimeter of the ocean. In contrast, ocean heat content requires temperature profiles from the surface to depth, historically obtained from expendable bathythermographs (XBTs) and mechanical bathythermographs (MBTs) deployed by ships, and since the early 2000s, predominantly from the Argo array of profiling floats. Argo floats drift with ocean currents, periodically diving to 2,000 meters and then ascending while measuring temperature and salinity, transmitting data via satellite.
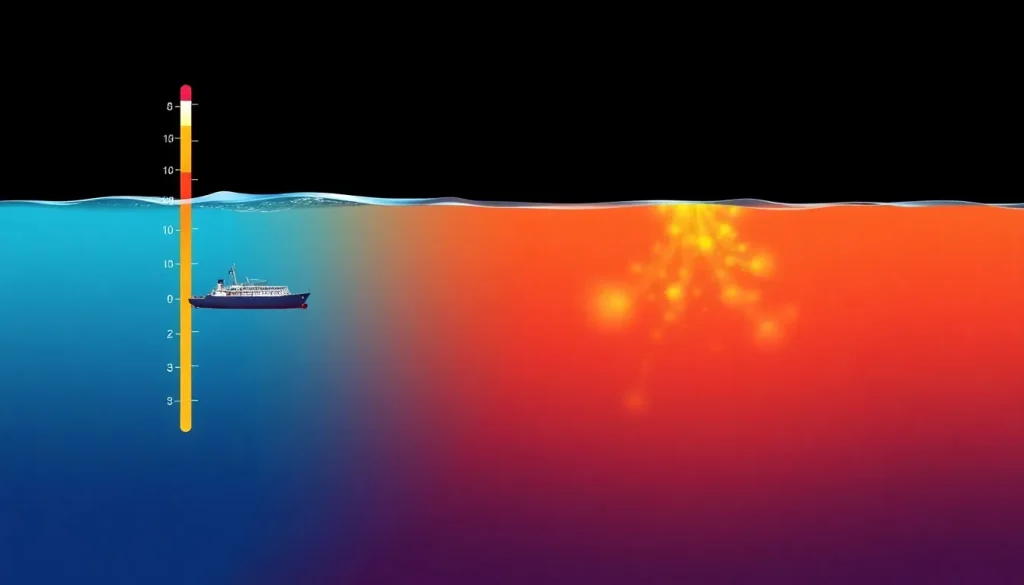
The ocean’s heat storage is not uniform; it is concentrated in the upper layers. The mixed layer, typically the top 50–200 meters, is well stirred by wind and waves, and its temperature closely tracks SST. Below that, the thermocline marks a rapid temperature decrease with depth. Most of the excess heat from global warming is stored in the upper 2,000 meters, but a significant portion also penetrates deeper, especially in regions of deep-water formation. OHC is calculated by integrating the temperature anomaly (difference from a baseline) over depth and multiplying by the density and specific heat capacity of seawater. This integration makes OHC a more robust measure of the Earth’s energy imbalance than SST alone.
Importance and Impact
Ocean heat content is a critical indicator of climate change because the ocean absorbs more than 90% of the excess energy trapped by greenhouse gases. This energy accumulation drives sea-level rise through thermal expansion—warmer water occupies more volume—and contributes to the melting of ice shelves and glaciers. Rising OHC also fuels more intense tropical cyclones, as warmer upper-ocean heat provides energy for storm intensification. Long-term increases in OHC are unequivocal and show that the Earth is steadily warming, even during periods when surface temperatures appear to plateau.
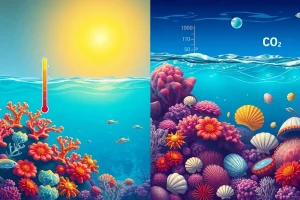
Sea-surface temperature, while more variable, has direct impacts on weather and ecosystems. Elevated SSTs can lead to coral bleaching, disrupt marine food webs, and influence atmospheric circulation patterns such as the El Niño–Southern Oscillation (ENSO). SST anomalies are used to predict seasonal climate outlooks, hurricane activity, and monsoon strength. Both OHC and SST are essential for understanding the full scope of ocean warming: OHC reveals the total heat budget, while SST indicates how that heat interacts with the atmosphere and biosphere.
Regional Differences
Sea-surface temperature varies widely across the globe due to latitude, ocean currents, and upwelling. The tropics have consistently warm SSTs, while polar regions are near freezing. Ocean heat content, however, shows that the Southern Ocean and the North Atlantic are major heat sinks, absorbing a disproportionate share of excess heat. The Southern Ocean, in particular, takes up a large fraction of anthropogenic heat and carbon due to its strong westerly winds and deep mixed layers. In contrast, the tropical Pacific exhibits strong interannual variability in SST due to ENSO, but its OHC trends are more gradual.
Regional differences in OHC uptake are influenced by ocean circulation patterns. For example, the Atlantic Meridional Overturning Circulation (AMOC) transports heat northward, leading to higher OHC in the North Atlantic. The Indo-Pacific warm pool has the highest SSTs but relatively shallow heat storage, while the subtropical gyres accumulate heat in deeper layers. Understanding these regional patterns is crucial for projecting sea-level rise, as thermal expansion is not uniform—some regions experience faster relative sea-level rise due to changes in ocean heat distribution.
Connections to Other Systems
Ocean heat content and sea-surface temperature are tightly linked to the atmosphere, cryosphere, and biosphere. SST anomalies drive atmospheric convection, influencing the location and intensity of rainfall, droughts, and storm tracks. The El Niño–Southern Oscillation, characterized by periodic warming (El Niño) and cooling (La Niña) of the tropical Pacific SST, has global teleconnections affecting weather patterns worldwide. OHC, by storing heat at depth, can precondition the ocean for subsequent El Niño events and modulate their intensity.
In the cryosphere, warmer SSTs accelerate the melting of sea ice and marine-terminating glaciers, while increased OHC contributes to basal melting of ice shelves. The ocean’s heat uptake also affects the carbon cycle: warmer waters hold less dissolved carbon dioxide, reducing the ocean’s capacity to absorb CO₂ from the atmosphere. This feedback loop can amplify warming. Additionally, changes in OHC and SST influence marine ecosystems, from phytoplankton productivity to fish migration patterns, with cascading effects on food security and fisheries.
Data Limitations and Uncertainties
Historical SST records rely on ship-based measurements that have known biases, such as the transition from bucket to engine-intake methods, which require careful correction. Satellite SST data, while global, are limited to cloud-free conditions for infrared sensors and have lower resolution for microwave sensors. In contrast, OHC measurements have improved dramatically with the Argo array, but coverage is sparse before the 2000s, and the deep ocean below 2,000 meters remains poorly sampled. This leads to uncertainties in the total heat uptake, particularly in the deep and abyssal layers.
Another challenge is the baseline period used for anomalies. OHC and SST anomalies are calculated relative to a reference period, and the choice of baseline can affect trend estimates. Additionally, natural variability on decadal timescales, such as the Pacific Decadal Oscillation, can mask or amplify long-term trends in both metrics. Despite these limitations, multiple independent datasets confirm that the ocean is warming at an accelerating rate, and the uncertainties are well characterized and shrinking over time.
Common Misconceptions
A common misconception is that a slowdown or pause in global surface temperature warming means global warming has stopped. In reality, the ocean continues to accumulate heat, and OHC shows no pause. The so-called “hiatus” in the early 2000s was largely a surface phenomenon; OHC increased steadily throughout. Another misconception is that SST and OHC are interchangeable. While they are related, SST can be influenced by short-term weather and does not reflect the total heat stored in the ocean column. A region with high SST may have low OHC if the warm layer is shallow.
Some also assume that because the ocean is vast, it can absorb unlimited heat without consequence. However, rising OHC contributes to sea-level rise, stronger storms, and marine heatwaves that devastate ecosystems. Finally, there is a misconception that OHC data are too uncertain to be useful. While uncertainties exist, the long-term trend is robust and supported by multiple lines of evidence, making OHC one of the most reliable indicators of a warming planet.
FAQ
What is the difference between ocean heat content and sea-surface temperature?
Ocean heat content measures the total thermal energy stored in the ocean from the surface to the seafloor, while sea-surface temperature is the temperature of the ocean's top layer. OHC is a more comprehensive measure of ocean warming.
Why is ocean heat content a better indicator of global warming?
Because the ocean absorbs over 90% of the excess heat from greenhouse gases, and OHC is less affected by short-term weather variability, making it a more stable and reliable long-term climate indicator.
How do scientists measure ocean heat content?
Primarily using the Argo array of profiling floats, which dive to 2,000 meters and measure temperature and salinity as they ascend. Historical data come from ship-based instruments.
References
- IPCC Special Report on the Ocean and Cryosphere in a Changing Climate (SROCC)
- NOAA National Centers for Environmental Information: Ocean Heat Content
- NASA Earth Observatory: Sea Surface Temperature