In brief
At a glance
Quick Facts
- Current figure
- 2.8°C median warming by 2100
- Measurement date
- 2023 (UNEP Emissions Gap Report 2023)
- Previous figure
- 2.7°C (2022 report)
- Change
- +0.1°C (+3.7%)
- Data source
- UNEP Emissions Gap Report 2023
- Next update
- November 2024
Current figure
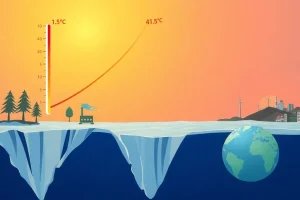
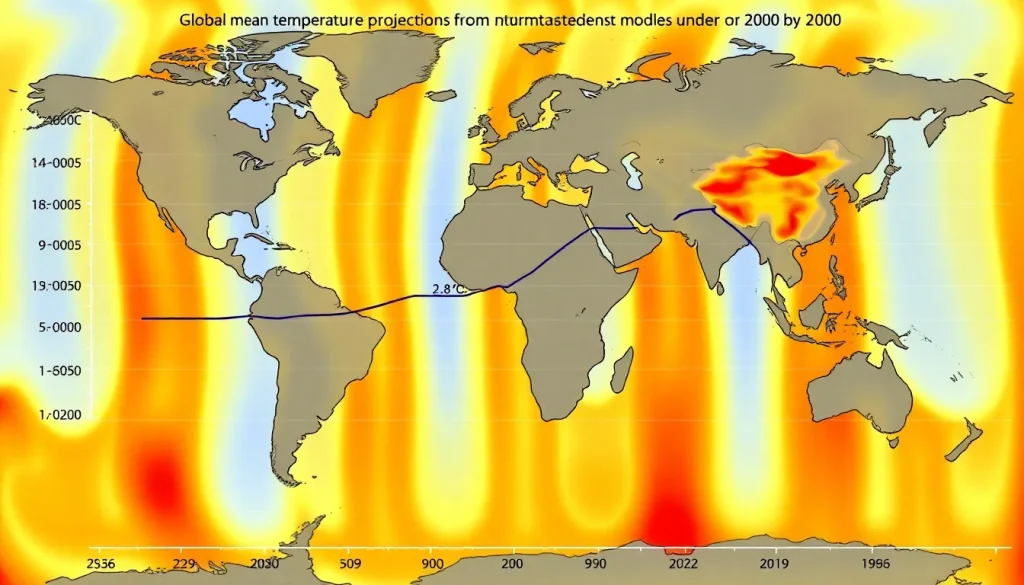
Under policies currently in place globally, integrated assessment models (IAMs) project a median global mean temperature increase of 2.8°C by 2100, relative to pre-industrial levels. This figure is reported in the United Nations Environment Programme (UNEP) Emissions Gap Report 2023, with a likely range (66% confidence) of 2.5°C to 2.9°C.
Measurement date
The 2.8°C projection is based on modelling runs and policy assessments completed in 2023, as published in the UNEP Emissions Gap Report 2023 (released November 2023). The report is updated annually, drawing on the latest national policy announcements, energy system data, and climate model simulations available at the time of analysis.
Previous figure
The UNEP Emissions Gap Report 2022 estimated that current policies would lead to a median warming of 2.7°C by 2100, with a likely range of 2.4°C to 3.1°C. The 2023 figure therefore represents an increase of 0.1°C (approximately 3.7%) in the median projection. This upward revision reflects updated policy assessments and a slight worsening of the emissions trajectory, as global greenhouse gas emissions continued to rise in 2022.
Long-term trend
IAM-based projections of 21st-century warming under current policies have fluctuated over the past decade, but the long-term trend shows a gradual decline from earlier, higher estimates as some climate policies have been implemented. The table below summarises median warming projections from successive UNEP Emissions Gap Reports.
| Report Year | Median Warming by 2100 (°C) | Likely Range (°C) |
|---|---|---|
| 2015 | 3.5 | 3.0–4.1 |
| 2016 | 3.4 | 2.9–3.9 |
| 2017 | 3.2 | 2.7–3.7 |
| 2018 | 3.2 | 2.7–3.7 |
| 2019 | 3.2 | 2.7–3.7 |
| 2020 | 3.0 | 2.6–3.5 |
| 2021 | 2.9 | 2.5–3.3 |
| 2022 | 2.7 | 2.4–3.1 |
| 2023 | 2.8 | 2.5–2.9 |
Note: The 2023 report’s narrower range reflects updated modelling and policy assumptions. The long-term trend shows a decline from earlier estimates above 3°C, but the 2023 figure indicates a stall in progress, with the median warming projection slightly higher than in 2022.
Data source
The primary data source is the United Nations Environment Programme (UNEP) Emissions Gap Report 2023, which synthesises projections from multiple integrated assessment models (IAMs) and climate models. The report is available at unep.org. Underlying IAM data come from modelling teams contributing to the IPCC and the Energy Modeling Forum (EMF), including models such as IMAGE, MESSAGEix, GCAM, and REMIND-MAgPIE.
Methodology
Integrated assessment models (IAMs) are computer models that combine representations of the global economy, energy system, land use, and climate to explore future scenarios. They typically work in two stages: first, they simulate how economic activity, technological change, and policy choices drive greenhouse gas emissions; second, they feed those emissions into a simplified climate model (often a carbon cycle and energy balance model) to estimate resulting temperature changes. The current policies scenario assumes that all policies enacted or adopted by governments as of the cut-off date (mid-2023 for the 2023 report) continue indefinitely, with no additional strengthening. The median warming is the 50th percentile of the distribution of outcomes across multiple IAMs and climate model runs, reflecting uncertainties in both socio-economic pathways and climate sensitivity.
Why annual values fluctuate
Year-to-year changes in the projected warming under current policies can arise from several factors:
- Policy updates: New national climate pledges or rollbacks alter the emissions trajectory.
- Economic data revisions: Updated GDP, population, and energy intensity data shift baseline emissions.
- Model improvements: IAMs are periodically updated with better representations of technologies, costs, and climate feedbacks.
- Emissions inventory updates: Revisions to historical emissions data affect the starting point for projections.
- Climate sensitivity estimates: Refinements in the understanding of how the climate responds to CO₂ can change the warming per unit of emissions.
The 0.1°C increase from 2022 to 2023 was primarily due to the inclusion of more recent emissions data showing a continued rise in global CO₂ emissions, and a reassessment of the effectiveness of some existing policies.
Regional variation
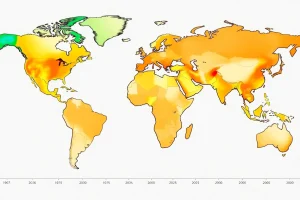
While the global median warming is 2.8°C, regional temperature increases are expected to be higher over land and in the Arctic. IAMs do not directly project regional climate impacts, but their emissions scenarios are used by regional climate models. The table below shows projected warming by region under a current-policies-like scenario (SSP2-4.5) from the IPCC Sixth Assessment Report, which is broadly consistent with a 2.8°C global mean increase.
| Region | Projected Warming by 2100 (°C, relative to 1850–1900) |
|---|---|
| Global mean | 2.8 |
| Arctic | 5.0–7.0 |
| Northern Europe | 3.0–4.0 |
| Mediterranean | 3.5–4.5 |
| Sub-Saharan Africa | 2.5–3.5 |
| South Asia | 2.5–3.5 |
| Small Island States | 2.0–3.0 (but high sea-level rise risk) |
Source: IPCC AR6 WGI (2021) regional projections for SSP2-4.5, scaled to a 2.8°C global mean.
Meaning and limitations
The 2.8°C figure represents the median estimate of long-term global warming if current policies remain unchanged. It is not a prediction but a scenario-based projection, conditional on assumptions about future technology, population, and economic growth. Key limitations include:
- Policy representation: IAMs may not capture all implemented policies, especially non-price measures, and may over- or underestimate their effectiveness.
- Model uncertainty: Different IAMs yield different results due to structural differences; the range across models is often wider than the reported likely range.
- Climate sensitivity: The equilibrium climate sensitivity remains uncertain (IPCC AR6 likely range 2.5°C to 4°C per CO₂ doubling), which directly affects warming projections.
- Tipping points: IAMs generally do not include dynamic ice sheet melt or permafrost carbon feedbacks, which could amplify warming.
- Timing: The projection is for 2100, but warming will continue beyond that date if net-zero emissions are not achieved.
Thus, the figure is best interpreted as a central estimate of the long-term outcome of current policy ambition, not a precise forecast.
Next expected update
The next UNEP Emissions Gap Report is expected to be published in November 2024, providing an updated assessment of the emissions gap and projected warming under current policies, as well as under new or updated nationally determined contributions (NDCs). The report is released annually ahead of the UN Climate Change Conference (COP).
Downloadable chart or table
The table below provides key historical data points for median warming projections under current policies from UNEP reports. The full dataset, including scenario assumptions and model-by-model results, can be downloaded from the UNEP Emissions Gap Report website or the IPCC AR6 Scenario Explorer hosted by IIASA.
| Year of Report | Median Warming by 2100 (°C) | Lower Bound (66% range) | Upper Bound (66% range) |
|---|---|---|---|
| 2015 | 3.5 | 3.0 | 4.1 |
| 2016 | 3.4 | 2.9 | 3.9 |
| 2017 | 3.2 | 2.7 | 3.7 |
| 2018 | 3.2 | 2.7 | 3.7 |
| 2019 | 3.2 | 2.7 | 3.7 |
| 2020 | 3.0 | 2.6 | 3.5 |
| 2021 | 2.9 | 2.5 | 3.3 |
| 2022 | 2.7 | 2.4 | 3.1 |
| 2023 | 2.8 | 2.5 | 2.9 |
Data source: UNEP Emissions Gap Reports 2015–2023. The 2023 range is narrower due to updated methodology; see the report for details.
FAQ
What is an integrated assessment model (IAM)?
An integrated assessment model is a computer simulation that links economic, energy, land-use, and climate systems to evaluate the interactions between human activities and the environment. IAMs are used to project future greenhouse gas emissions, assess policy options, and estimate the resulting climate change. They range from detailed process-based models to simpler cost-benefit frameworks, and they underpin most long-term climate scenarios in IPCC reports.
How reliable are IAM projections of future warming?
IAM projections are scenario-based, not predictions. Their reliability depends on the accuracy of input assumptions (e.g., economic growth, technology costs, policy stringency) and the model’s representation of complex systems. While they capture broad trends, uncertainties remain, particularly regarding climate sensitivity, carbon cycle feedbacks, and future policy choices. The reported likely ranges attempt to quantify some of these uncertainties, but structural model differences can lead to a wider spread of outcomes.
Why did the projected warming increase from 2.7°C to 2.8°C in the latest report?
The 0.1°C increase in the UNEP 2023 report primarily reflects updated emissions data showing that global CO₂ emissions continued to rise in 2022, and a reassessment of the effectiveness of some existing policies. It does not necessarily mean that policies have weakened, but rather that the baseline emissions trajectory has been revised upward slightly, and the models now incorporate more recent information.
References
- UNEP (2023). Emissions Gap Report 2023: Broken Record – Temperatures hit new highs, yet world fails to cut emissions (again). Nairobi.
- IPCC (2021). Climate Change 2021: The Physical Science Basis. Contribution of Working Group I to the Sixth Assessment Report.
- IPCC (2022). Climate Change 2022: Mitigation of Climate Change. Contribution of Working Group III to the Sixth Assessment Report.
- Riahi, K. et al. (2017). The Shared Socioeconomic Pathways and their energy, land use, and greenhouse gas emissions implications: An overview. Global Environmental Change, 42, 153-168.
- UNEP (2022). Emissions Gap Report 2022: The Closing Window – Climate crisis calls for rapid transformation of societies. Nairobi.