In brief
At a glance
Quick Facts
- Current figure
- Total: 36.6 GtCO2; Per capita: 4.7 tCO2
- Measurement date
- 2022
- Previous figure
- 2021: 36.3 GtCO2 total, 4.7 tCO2 per capita
- Change
- Total: +0.3 GtCO2 (+0.8%); Per capita: no change
- Data source
- Global Carbon Project (Global Carbon Budget 2023)
- Next update
- December 2024 (Global Carbon Budget 2024)
Current figure
In 2022, global total carbon dioxide (CO2) emissions from fossil fuel combustion and industrial processes (cement production, etc.) were approximately 36.6 billion tonnes (GtCO2). The corresponding global per-capita CO2 emissions averaged 4.7 tonnes per person (tCO2/capita). These figures are from the Global Carbon Budget 2023, published by the Global Carbon Project.
Measurement date
The current figures refer to the calendar year 2022. The Global Carbon Budget is published annually, typically in December, with preliminary estimates for the current year and finalised data for the previous year. The 2023 edition (released in December 2023) provides the 2022 values used here.
Previous figure
In 2021, global total CO2 emissions were 36.3 GtCO2, and per-capita emissions were also 4.7 tCO2 per person. The total increased by 0.3 GtCO2 (+0.8%), while per-capita emissions remained essentially unchanged due to population growth offsetting the slight rise in total emissions.
Long-term trend
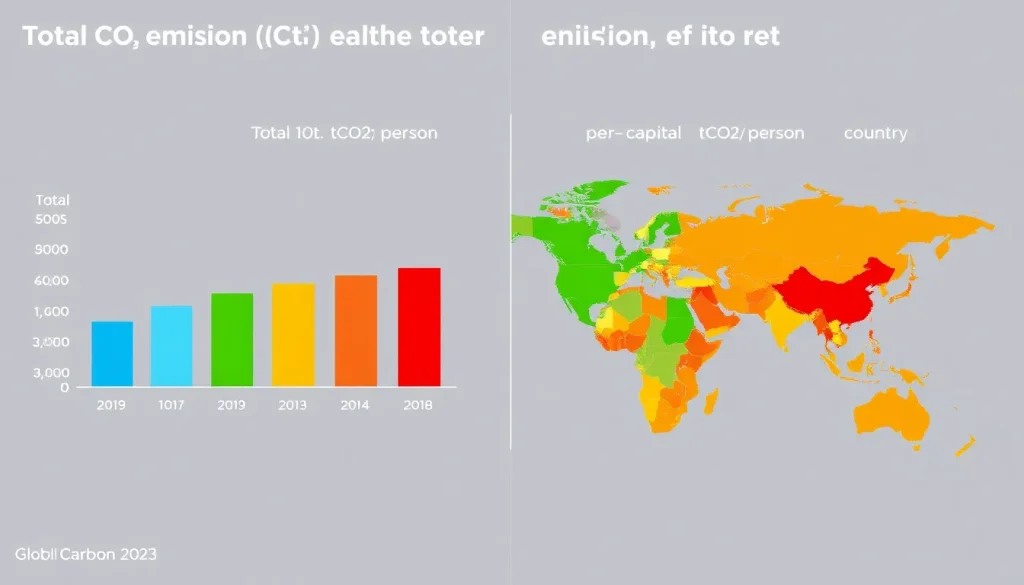
Global CO2 emissions have risen dramatically since the mid-20th century. Total emissions increased from about 6 GtCO2 in 1950 to over 36 GtCO2 in 2022. Per-capita emissions peaked around 2012 at 4.9 tCO2 per person and have since plateaued or slightly declined, reflecting efficiency gains and a shift to lower-carbon energy sources in some regions, while total emissions continue to grow due to population increases and economic development in emerging economies.
| Year | Total CO2 emissions (GtCO2) | Per-capita emissions (tCO2/person) |
|---|---|---|
| 1960 | 9.4 | 3.1 |
| 1970 | 14.9 | 4.0 |
| 1980 | 19.5 | 4.4 |
| 1990 | 22.7 | 4.3 |
| 2000 | 25.6 | 4.2 |
| 2010 | 33.4 | 4.8 |
| 2015 | 35.4 | 4.8 |
| 2020 | 34.8 | 4.5 |
| 2021 | 36.3 | 4.7 |
| 2022 | 36.6 | 4.7 |
Source: Global Carbon Budget 2023; Our World in Data based on Global Carbon Project.
Data source
The primary data source is the Global Carbon Budget 2023, an annual report produced by the Global Carbon Project (GCP), a consortium of international scientists. The dataset integrates emissions estimates from fossil fuel combustion, cement production, and other industrial processes, as well as land-use change. The data are publicly available at globalcarbonbudget.org and are also accessible via Our World in Data.
Methodology
Total CO2 emissions are estimated using energy statistics from sources like the International Energy Agency (IEA) and the United Nations, combined with data on cement production and gas flaring. Per-capita emissions are calculated by dividing total national emissions by the country’s population (using UN population estimates). The figures represent territorial emissions (emissions within a country’s borders) and do not account for emissions embedded in traded goods (consumption-based emissions). The Global Carbon Budget also includes uncertainties: for fossil CO2 emissions, the 1-sigma uncertainty is approximately ±5% for global totals (around ±1.8 GtCO2).
Why annual values fluctuate
Year-to-year changes in total CO2 emissions are driven by economic growth or contraction, energy demand (influenced by weather), fuel prices, and policy changes. For example, the COVID-19 pandemic caused a sharp drop in 2020, followed by a rebound in 2021. Per-capita emissions also fluctuate with these factors but are moderated by population growth. In 2022, total emissions rose slightly, but per-capita emissions remained flat because population growth absorbed the increase.
Regional variation
There is enormous variation in both total and per-capita emissions across countries. High-income and oil-producing nations tend to have high per-capita emissions, while populous developing countries have high total emissions but lower per-capita figures. The table below shows 2022 data for selected countries.
| Country | Total emissions (GtCO2) | Per-capita emissions (tCO2/person) |
|---|---|---|
| China | 11.4 | 8.0 |
| United States | 5.1 | 15.2 |
| India | 2.9 | 2.0 |
| Russia | 1.7 | 11.4 |
| Japan | 1.1 | 8.6 |
| Qatar | 0.1 | 35.6 |
| Germany | 0.7 | 8.1 |
| World | 36.6 | 4.7 |
Source: Global Carbon Budget 2023; population data from UN. Note: Qatar’s per-capita emissions are exceptionally high due to a small population and large energy exports.
Meaning and limitations
Total emissions indicate a country’s overall contribution to global greenhouse gas concentrations and are crucial for setting absolute emission reduction targets. Per-capita emissions reflect the average carbon footprint of an individual and are often used in equity discussions, as they highlight disparities in lifestyle and energy use. However, both metrics have limitations. Total emissions do not account for population size, so large countries naturally have higher totals. Per-capita emissions can mask within-country inequality (e.g., high emitters in a low-average country) and ignore historical responsibility. Moreover, territorial emissions exclude emissions from international aviation and shipping and do not reflect consumption-based emissions (carbon footprint of imported goods). For a complete picture, both metrics should be considered alongside cumulative historical emissions and consumption-based accounting.
Next expected update
The Global Carbon Budget 2024 is expected to be published in December 2024, providing preliminary estimates for 2023 and finalised data for 2022. The release typically occurs during the UN Climate Change Conference (COP).
Downloadable chart or table
The table below provides key historical data points for global total and per-capita CO2 emissions. The full dataset can be downloaded from the Global Carbon Budget website (globalcarbonbudget.org) or from Our World in Data’s CO2 emissions dataset.
| Year | Total (GtCO2) | Per capita (tCO2) |
|---|---|---|
| 1960 | 9.4 | 3.1 |
| 1970 | 14.9 | 4.0 |
| 1980 | 19.5 | 4.4 |
| 1990 | 22.7 | 4.3 |
| 2000 | 25.6 | 4.2 |
| 2010 | 33.4 | 4.8 |
| 2015 | 35.4 | 4.8 |
| 2020 | 34.8 | 4.5 |
| 2021 | 36.3 | 4.7 |
| 2022 | 36.6 | 4.7 |
FAQ
Why is it important to consider both per-capita and total environmental impact?
Total impact shows a country’s absolute contribution to global problems like climate change, which is critical for setting reduction targets. Per-capita impact highlights individual responsibility and equity, revealing disparities in consumption and lifestyle. Using only one metric can be misleading: a large country may have high total emissions but low per-capita emissions, while a small wealthy nation may have low total but very high per-capita emissions. Both perspectives are needed for fair and effective policy.
Which countries have the highest per-capita CO2 emissions?
In 2022, the highest per-capita CO2 emissions were recorded in small, oil-rich nations such as Qatar (35.6 tCO2/person), Kuwait, and the United Arab Emirates. Among larger economies, the United States (15.2 tCO2/person), Canada, and Australia also have high per-capita emissions. These figures reflect high energy consumption and, in some cases, emissions from fossil fuel extraction and export industries.
How do per-capita emissions relate to climate equity?
Per-capita emissions are central to climate equity debates because they highlight historical responsibility and the right to development. Developed nations have emitted far more CO2 per person over time, while many developing nations have low per-capita emissions but are most vulnerable to climate impacts. Equity frameworks often propose that emission reduction targets should consider both current per-capita emissions and cumulative historical emissions to ensure a fair transition.
References
- Global Carbon Project. (2023). Global Carbon Budget 2023. https://globalcarbonbudget.org/
- Our World in Data. CO2 emissions dataset. https://ourworldindata.org/co2-emissions
- Friedlingstein, P. et al. (2023). Global Carbon Budget 2023. Earth System Science Data.
- IPCC. (2021). Climate Change 2021: The Physical Science Basis. Contribution of Working Group I to the Sixth Assessment Report.
- European Commission, Joint Research Centre. EDGAR - Emissions Database for Global Atmospheric Research. https://edgar.jrc.ec.europa.eu/