In brief
At a glance
Quick Facts
- Common definition
- Water stress is typically the ratio of total water withdrawals to available renewable water supply.
- Key indicator
- The UN SDG indicator 6.4.2 measures water stress as freshwater withdrawal as a proportion of available freshwater resources.
- Spatial resolution impact
- A country-level map may hide severe stress in specific basins, while high-resolution maps can reveal local hotspots.
- Data variability
- Estimates of renewable water resources can vary by 30% or more between different global datasets.
- Groundwater challenge
- Groundwater use is often poorly quantified, leading to significant uncertainty in stress calculations.
- Environmental flows
- Some maps include environmental flow requirements, while others do not, altering stress classifications.
- Population affected
- Studies show the percentage of global population living in water-scarce areas can range from 25% to 60% depending on the indicator used.
Key Takeaways
- Global water-stress maps can show conflicting results because they use different definitions of water stress, such as the ratio of withdrawals to supply or the number of people affected.
- Variations in data sources—from satellite observations to government statistics—and modeling approaches introduce significant discrepancies.
- Spatial and temporal scales matter: a map showing annual averages at the country level may miss seasonal or local water stress hotspots.
- These disagreements have real-world consequences, influencing where billions of dollars in water infrastructure and aid are directed.
What Is Why Global Water-Stress Maps Sometimes Disagree?
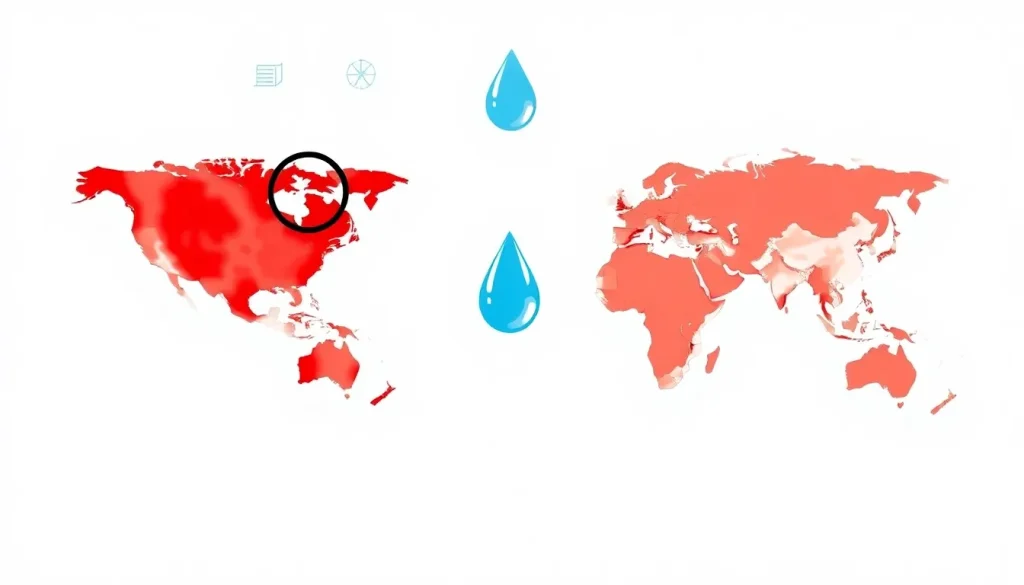
Global water-stress maps are visual tools that show the level of pressure on freshwater resources in different parts of the world. They are produced by research institutions, international organizations, and governments to identify regions where water demand is high relative to available supply. However, these maps often disagree—a region may appear severely water-stressed on one map but only moderately stressed on another. The question “Why do global water-stress maps sometimes disagree?” addresses the underlying reasons for these discrepancies, which stem from differences in definitions, data, methodologies, and the intended use of each map. Understanding these reasons is essential for interpreting the maps correctly and making informed decisions about water management, policy, and investment.
Water-stress maps are not direct measurements of reality but rather models that synthesize multiple data layers. They belong to the broader category of environmental indicators and risk assessments. Their purpose is to communicate complex hydrological and socio-economic information in an accessible format. However, because water stress is a multifaceted concept—encompassing physical scarcity, economic constraints, and environmental needs—there is no single universally accepted method for mapping it. Consequently, the maps can diverge significantly, leading to confusion among policymakers, businesses, and the public. This article explores the main reasons behind these disagreements, the implications, and how to interpret such maps critically.
How It Works
Water-stress maps are created by combining data on water availability (supply) and water use (demand). The basic formula for water stress is often expressed as the ratio of total water withdrawals to available renewable water resources. A region is typically considered water-stressed if this ratio exceeds 20–40%, depending on the threshold used. However, the process involves several steps: defining the spatial unit (e.g., grid cell, watershed, country), selecting a time period (annual, monthly), gathering data on surface water, groundwater, and precipitation, and estimating withdrawals for agriculture, industry, and domestic use. These estimates are then compared to the renewable supply, which may include environmental flow requirements—the water needed to sustain ecosystems. The resulting stress levels are classified into categories (e.g., low, medium, high, extremely high) and displayed on a map.

Different organizations use different models and assumptions. For example, the World Resources Institute’s Aqueduct tool calculates baseline water stress as the ratio of total annual water withdrawals to available renewable surface water and groundwater. The UN’s SDG indicator 6.4.2 uses a similar ratio but may incorporate different data sources and thresholds. Some maps focus on physical water stress, while others include economic or social dimensions, such as access to clean water or infrastructure capacity. The choice of indicator, data source, and modeling technique all influence the final map, creating potential for disagreement.
Main Causes or Drivers
The primary drivers of disagreement among water-stress maps can be grouped into three categories: definitional differences, data source variability, and methodological choices.
- Definitional differences: Water stress can be defined in multiple ways. The most common is the withdrawal-to-availability ratio, but some maps use water consumption (water that is not returned to the source) instead of withdrawals. Others incorporate population density, per capita water availability, or the Falkenmark indicator (water per person per year). Some maps focus on physical scarcity, while others include economic or institutional factors. These varying definitions lead to different stress classifications for the same region.
- Data source variability: Maps rely on data from national governments, satellite observations, and global hydrological models. National data may be outdated, incomplete, or politically biased. Satellite data provides consistent global coverage but has limitations in measuring groundwater or small-scale withdrawals. Global models fill gaps but introduce their own uncertainties. For example, estimates of renewable water resources can vary by 30% or more between different global datasets.
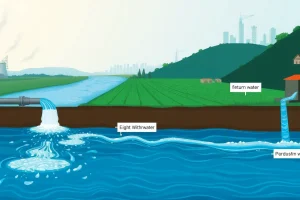
- Methodological choices: The spatial resolution (grid cell size, watershed vs. administrative boundaries) and temporal resolution (annual vs. monthly) greatly affect results. A country-level map may show low stress, but a high-resolution map could reveal severe stress in specific basins. Additionally, the inclusion or exclusion of environmental flow requirements, return flows, and inter-basin transfers can change the picture. Some maps use future climate projections, adding another layer of uncertainty.
Data Limitations and Uncertainties
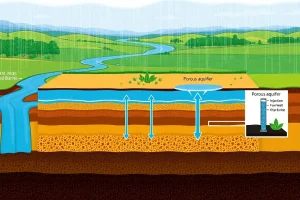
All water-stress maps are built on data that contain inherent limitations and uncertainties. Global hydrological models, which simulate water availability, are calibrated with limited ground observations, especially in data-sparse regions like Africa and parts of Asia. Precipitation data from satellites or reanalysis products can have significant biases. Water withdrawal data is often estimated using sectoral models (e.g., irrigation demand based on crop types and climate) rather than actual metered measurements, which are rare. Groundwater use is particularly difficult to quantify, as it is often unregulated and unmonitored. These uncertainties propagate through the water stress calculation, leading to different outcomes depending on which dataset is used.
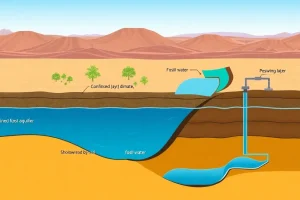
Furthermore, the concept of “available renewable water resources” itself is uncertain. It depends on assumptions about groundwater recharge rates, the sustainability of surface water flows, and the impact of climate variability. Some maps use long-term averages, while others incorporate interannual variability. The treatment of non-renewable groundwater (fossil aquifers) also varies: some maps exclude it, while others include it, which can dramatically change stress levels in arid regions that rely on groundwater mining. These data limitations mean that even maps using the same definition can disagree if they draw from different underlying datasets.
Regional Differences
Disagreements among water-stress maps are often most pronounced in regions with high spatial variability, data scarcity, or transboundary water resources. For example, in the Middle East and North Africa, some maps show extreme water stress across the entire region, while others highlight specific basins or countries as critically stressed but not others. This can be due to how shared rivers are allocated: one map might assign the full flow of the Nile to Egypt, while another divides it among all riparian countries. In South Asia, the timing of the monsoon and the use of groundwater for irrigation create large seasonal fluctuations that annual maps may miss. Sub-Saharan Africa often shows low water stress on global maps because withdrawals are low, but this masks the lack of infrastructure to access available water, a nuance captured only by maps that include economic water scarcity.
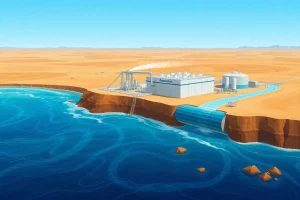
In developed regions, disagreements can arise from different accounting of water reuse and efficiency. For instance, in the southwestern United States, some maps show high stress due to high agricultural demand, while others that account for water recycling and desalination may show lower stress. These regional differences underscore the importance of using maps that are appropriate for the specific context and question at hand.
Importance and Impact
The fact that water-stress maps sometimes disagree has significant implications for policy, investment, and public perception. Governments and international agencies use these maps to prioritize funding for water infrastructure, drought preparedness, and humanitarian aid. If a region is misclassified as low-stress, it may be overlooked for critical investments, leading to future crises. Conversely, overestimating stress can divert resources from other pressing needs. Businesses, particularly in water-intensive sectors like agriculture, energy, and manufacturing, rely on these maps to assess operational risks and supply chain vulnerabilities. Disagreements can create confusion and lead to poor risk management decisions.
Moreover, the maps influence global discourse on water security and climate adaptation. They shape the narrative around which regions are “running out of water” and can affect geopolitical relations over shared water resources. Therefore, understanding the reasons for disagreement is not just an academic exercise; it is essential for making robust, evidence-based decisions in a world where water resources are increasingly strained.
What the Evidence Shows
Studies comparing multiple global water-stress maps have found substantial differences in the classification of water-stressed areas. For example, a comparison of five commonly used indicators revealed that the percentage of the global population living in water-scarce areas ranged from 25% to 60%, depending on the indicator. Research has also shown that the choice of spatial resolution can change the number of people classified as water-stressed by hundreds of millions. These findings highlight that no single map is definitive; each is a product of its assumptions and data. The evidence suggests that users should consult multiple maps and understand their underlying methodologies rather than relying on a single source. Additionally, ensemble approaches that combine multiple models can provide a more robust picture of water stress, though they are not yet standard practice.
FAQ
What is water stress?
Water stress occurs when the demand for water exceeds the available amount during a certain period or when poor quality restricts its use. It is commonly measured as the ratio of water withdrawals to renewable supply.
Why do water stress maps differ?
They differ because of varying definitions of water stress, different data sources (e.g., satellite vs. government statistics), modeling assumptions, spatial and temporal scales, and whether they include factors like environmental flows or economic access.
Why does it matter if water stress maps disagree?
Disagreements can misguide policy, investment, and aid decisions, potentially leaving vulnerable regions underprepared for water crises or misallocating resources. Accurate understanding is essential for effective water management and climate adaptation.
References
- World Resources Institute. Aqueduct Water Risk Atlas. https://www.wri.org/aqueduct
- FAO. AQUASTAT - FAO's Global Information System on Water and Agriculture. http://www.fao.org/aquastat
- United Nations. Sustainable Development Goal 6: Ensure availability and sustainable management of water and sanitation for all. https://sdgs.un.org/goals/goal6